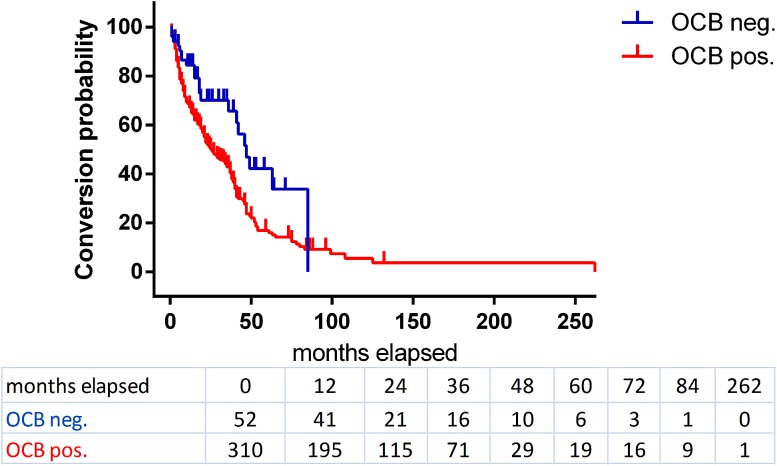
Fig. 2.
Kaplan–Meier survival curves for OCB-positive (red) and -negative (blue) CIS patients concerning the time of conversion to definite multiple sclerosis according to McDonald 2010 criteria. Patients who did not convert to definite MS and/or whose follow-up time was less than 24 months were censored (OCB pos. = 62, OCB neg. = 19, indicated by dash on the curve). The numbers of subjects at risk are given in the table under the graph

