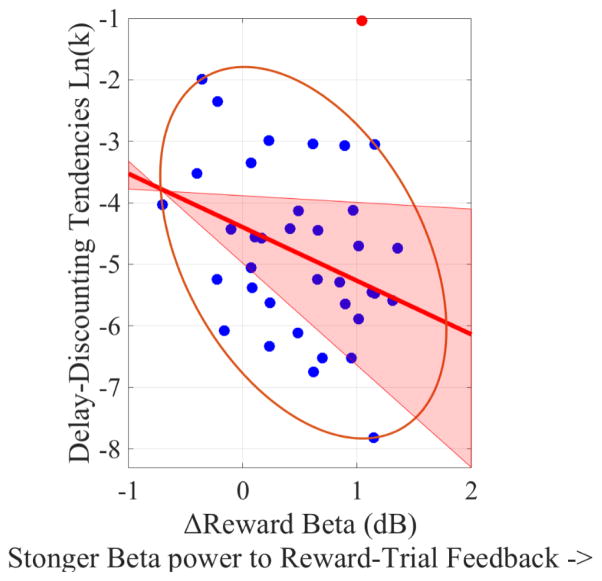
Figure 12. Scatterplot of the correlation between delay-discounting tendencies [ln(k)] the ΔReward feedback-locked beta (Reward-trial feedback-locked beta minus No-Reward-trial feedback-locked beta), collapsing across Bad- and Good-Performance feedbacks.
Note that, the more positive the ΔReward feedback-locked beta, the stronger the theta power during Reward trials (relative to No-Reward trials). Potentials bivariate outliers were detected using Minimum Covariance Determinant (MCD), and represented by red data points. Ellipses contain non-outlying data. Pink shaded areas represent 95% bootstrapped confident intervals around the linear regression line after the potential bivariate outliers were removed. While the Pearson zero-order correlation coefficient was not significant (r(35) = −.25, p=0.13), the correlation became significant after one bivariate outlier was removed (r(34) = −.36, p=0.03).

