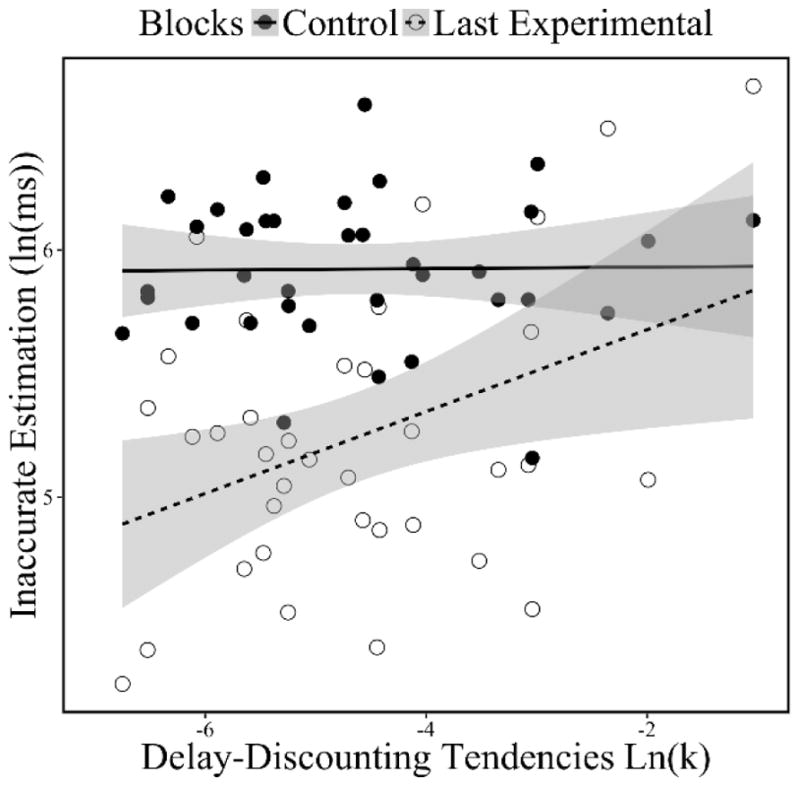
Figure 3. Scatterplot of the correlations between delay-discounting tendencies [ln(k)] and Control Inaccurate Estimation (i.e., during the control blocks) and Motivated-Learning Inaccurate Estimation (i.e., during the last (6th) experimental block).

Note: Delay-Discounting Tendencies ln(k) was significantly correlated with Motivated-Learning Inaccurate Estimation (during the last (6th) experimental block) (r(34) = .39, p = .02), but not with Control Inaccurate Estimation (during the control blocks) (r(34) = .01, p = .94). Inaccurate Estimation is the standard deviation from the goal of estimating 3.5 s. Hence, higher Inaccurate Estimation values reflect worse time-estimation performance. Control Inaccurate Estimation reflects participant’ time estimation ability prior to the experimental session, during when participants could not learn about their performance through feedback. Motivated-learning Inaccurate Estimation during the last block of the experimental session reflects how well participants had been motivated to learn through feedback over the course of the experimental session. Gray areas indicate the confident interval of 95% around the linear regression line.
