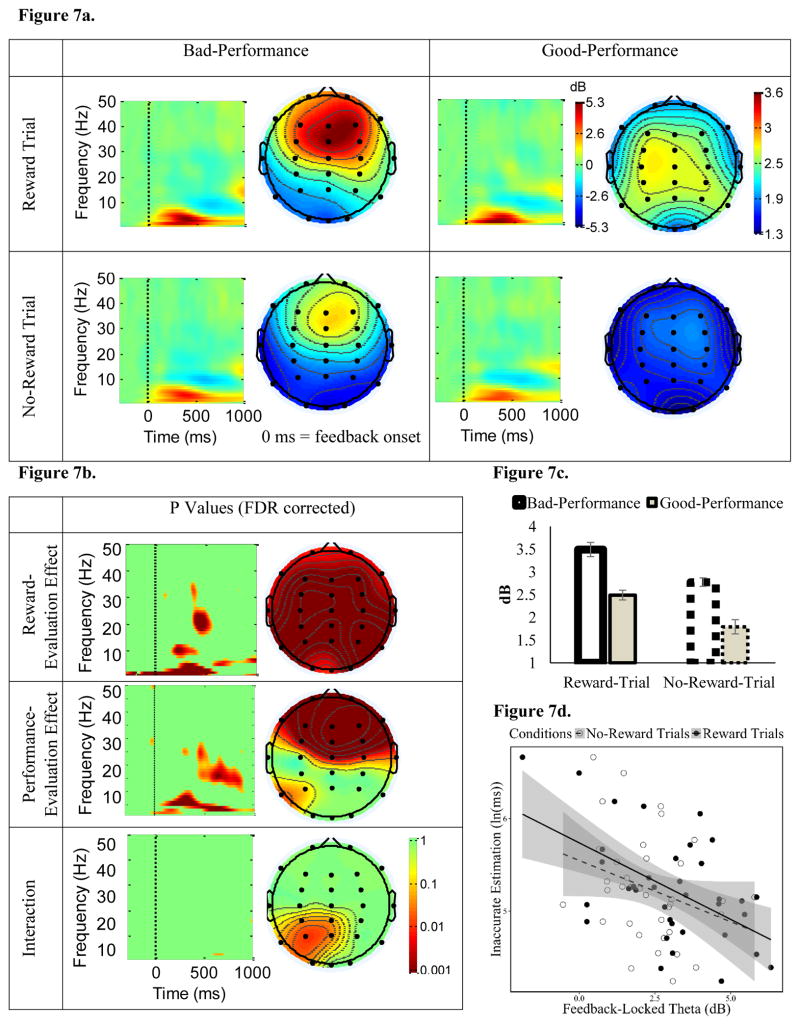
Figure 7. The influence of reward-evaluation and performance-evaluation on frontal-midline theta ERSP following feedback onset.
Figure 7a show ERSP time-frequency maps at the electrode Fz and topographic maps (the grand-average of theta ERSP power at 4–7 Hz, 200 – 400 ms window following feedback onset). ERSP activity locked to feedback onset is separated into reward evaluation (Reward-Trial vs. No-Reward Trial feedbacks) and performance evaluation (Bad-Performance vs. Good-Performance feedbacks). Note that we computed time-frequency maps from −830 to 1828 ms (see text). However, for visual proposes, we only show −300 to 1000 ms relative to the feedback onset here. Note also that heat-map scales for time-frequency and topographic maps are different. Figure 7b depicts p-values (FDR corrected) showing the main effect of Reward Evaluation (Reward Trial vs. No-Reward Trial), main effect of Performance Evaluation (Bad- vs. Good-Performance) and their interaction. For these p-value maps, the time-frequency map shows p values at each time and frequency at Fz, while the topographic map shows p values at the theta (4–8 Hz) band at the 200 – 400 ms window following feedback onset at every electrode. Figure 7c shows grand-average of theta power (4–7 Hz) at CPz during 200 – 400 ms window following feedback onset, separated by conditions. Error bars represent standard error of the mean, corrected for repeated-measure comparison. Figure 7d shows a scatterplot between Motivated-Learning Inaccurate Estimation (i.e., during the last experimental block) and feedback-locked theta ERSP (4–7 Hz, 200 – 400 ms window following feedback onset). In this scatterplot feedback-locked theta ERSP was separated to the ERSP during the Reward Trials and No-Reward Trials, collapsing across Bad- and Good-Performance. Gray areas indicate the confident interval of 95% around the regression line.

