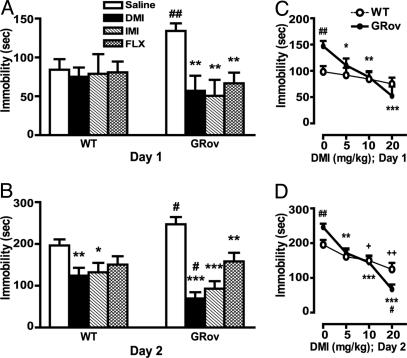
Fig. 4.
Increased behavioral response in GRov mice to antidepressant in the FST. (A) On day 1, the duration of immobility during the last 4 min of the 6-min test session was scored. ANOVA revealed a significant genotype × drug interaction (P < 0.05). **, P < 0.001 versus GRov saline control. ##, P < 0.01 versus WT saline control. (B) The duration of immobility during the entire 6-min test session on day 2 was scored. ANOVA yielded a significant geno-type × drug interaction (P < 0.05). *, P < 0.05; **, P < 0.01; ***, P < 0.0001 versus respective saline control. #, P < 0.05 versus WT group under the same treatment condition. The data are presented as mean ± SEM. WT mice: saline, n = 15; DMI, n = 10; IMI, n = 10; FLX n = 12; GRov mice: saline, n = 14; DMI, n = 9; IMI, n = 10; FLX, n = 12. (C) DMI dose–response curve on day 1. ANOVA yielded a significant genotype × drug interaction (P < 0.05). *, P < 0.05; **, P < 0.001; ***, P < 0.0001 versus GRov saline control. ##, P < 0.01 versus WT saline control. (D) DMI dose–response curve on day 2. ANOVA revealed a significant genotype × drug interaction (P < 0.01). **, P < 0.001; ***, P < 0.0001 versus GRov saline control. +, P < 0.05; ++,P < 0.01 versus WT saline control. #, P < 0.05; ##, P < 0.01 versus WT group under the same treatment condition. The data are presented as mean ± SEM. Mice: saline, n = 15; 5 mg/kg, n = 12; 10 mg/kg, n = 10; 20 mg/kg, n = 10 per genotype.

