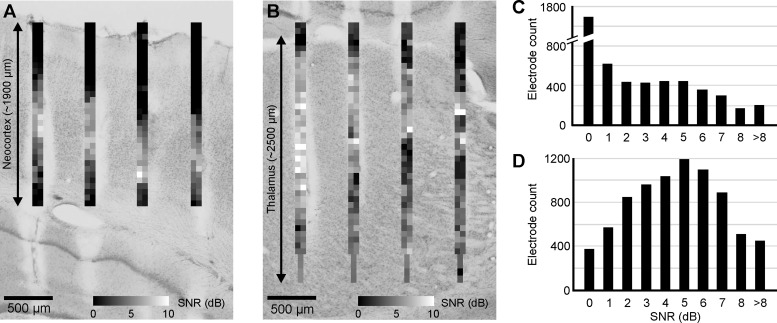
Fig. 3.
Signal-to-noise ratio (SNR) of cortical and thalamic unit activity recorded with the EDC probe. A: 2-dimensional SNR map calculated from the cortical recordings of a representative experiment. Each SNR value corresponds to a single recording site. The Nissl-stained coronal section in the background shows the corresponding cortical area with the tracks of the probe. Note that the highest SNR values are located in the granular and infragranular layers of the cortex. B: SNR map calculated in the thalamus of the same animal as in A with the corresponding thalamic anatomy. C: distribution of all calculated cortical SNR values. D: distribution of all calculated thalamic SNR values.

