Fig. 5.
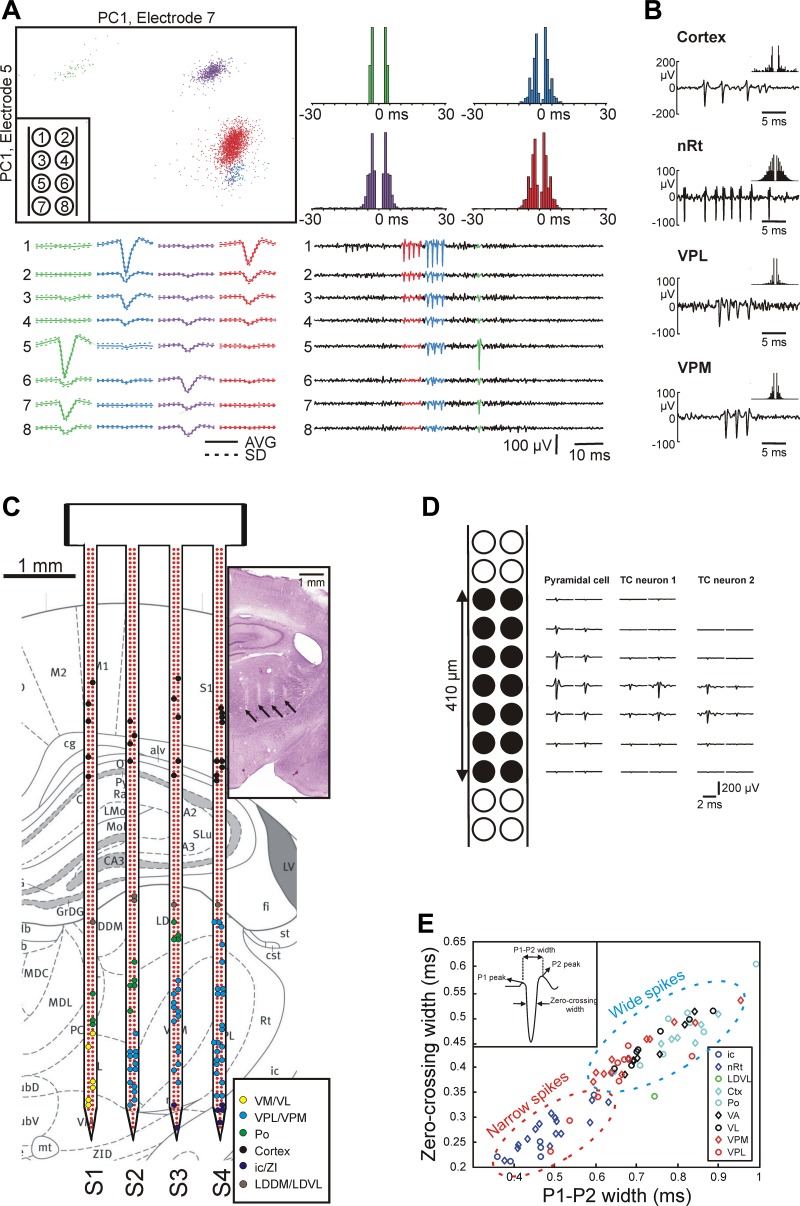
Evaluation of the single-unit activity (SUA) recorded with the EDC probe in anesthetized rats. A: results of spike sorting of a representative thalamic recording showing 4 well-isolated neuron clusters. The thalamic SUA was obtained from an octrode (8 adjacent recording sites; inset at top left) of a single shaft. Clustering was performed manually in 2-dimensional feature space [top left; first principal component (PC1) of spikes on 2 different channels]. Neuron clusters are represented with different colors. The action potential waveforms of the isolated units can be observed on multiple channels (bottom left, average spike waveform; bottom right, 100-ms-long traces of SUA; the electrode-channel relationship is shown in the inset at top left). The autocorrelograms corresponding to the neuron clusters show burst activity with 2–5 spikes per burst (top right; 1-ms bin width). B: action potential waveforms and autocorrelograms (±30 ms, 1-ms bin width) of representative sorted neurons located in the neocortex and in various thalamic nuclei. nRt, nucleus reticularis thalami; VPL, ventral posterolateral nucleus; VPM, ventral posteromedial nucleus. C: all sorted thalamic and cortical single units from a single experiment (colored dots) overlaid on the anatomical map of the coronal section [adapted from the rat brain atlas, Paxinos and Watson (2007), used with permission. This was published in The Rat Brain in Stereotaxic Coordinates, Paxinos and Watson, Copyright Elsevier (2007).] corresponding to the Nissl-stained section containing the probe tracks (inset; tracks of the probe are marked with black arrows). The single units are colored on the basis of their estimated anatomical location. Dots representing individual neurons are placed over the recording site that recorded the spikes of the particular unit with the largest amplitude. Note that the anatomical map of the coronal section is not faithfully representing the real brain tissue of the investigated rat; therefore, some of the dots are not placed over the correct anatomical structure (e.g., some of the black dots, which represent cortical neurons, are located outside the cortex). D: 2-dimensional spatial distribution of the mean action potential waveform of a putative pyramidal cell (left) and 2 putative thalamocortical (TC) cells (middle and right). Spiking activity was recorded with the black recording sites indicated at far left. Two separate but overlapping octrode recording configurations were used to obtain the data. Note the larger potential field of the spike of the putative pyramidal cell. E: distribution of the P1–P2 width (x-axis) and zero-crossing width (y-axis) calculated from the mean action potential waveform of a subgroup of the sorted units. The units were recorded from different brain areas. Two distinct groups can be observed: units from the nRt (inhibitory neurons) and internal capsule (ic; axonal fibers) displayed narrow spikes, whereas the majority of the remaining neurons fired wide spikes. LDDM, laterodorsal dorsomedial nucleus; LDVL, laterodorsal ventrolateral nucleus; Po, posterior nucleus; PtA, parietal association cortex; VA, ventral anterior nucleus; VL, ventral lateral nucleus; VM, ventral medial nucleus; ZI, zona incerta.

