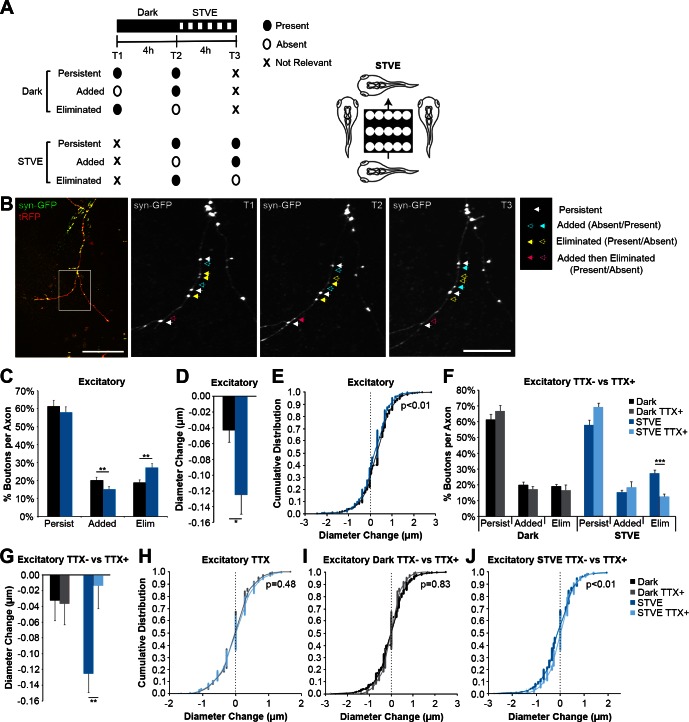
Fig. 7.
Visual experience induces structural plasticity of excitatory intertectal axon boutons in vivo. A: experimental protocol: 3 in vivo time-lapse 2-photon images were collected before (T1) and after (T2) free-swimming tadpoles were exposed to 4 h in the dark and again after exposure to 4 h of short-term visual enhancement (STVE; T3; left). Bouton dynamics were compared across the 3 time points. Some experiments were performed in the presence of tetrodotoxin (TTX) to uncouple bouton dynamics from visual stimulation. B: 2-photon z-projection of an intertectal axon expressing synaptophysin tagged with GFP (syn-GFP) and cytoplasmic turboRFP (tRFP). Scale bar = 100 μm. The boxed region was imaged at higher magnification (right). Scale bar = 25 μm. Bouton dynamics are highlighted with arrows. Closed and open arrows indicate the presence or absence of a bouton, respectively. White arrows: persistent through all time points; blue arrows: added; yellow arrows: eliminated; pink arrows: added and then eliminated. C: quantification of the percentage of excitatory boutons that persist, are added, or are eliminated during dark or STVE. STVE decreases addition (20.0 ± 1.9 vs. 15.1 ± 1.6%) and increases loss (18.8 ± 1.6 vs. 27.2 ± 2.3%) of excitatory boutons compared with dark (n = 21 axons; **P < 0.01). D and E: quantification of the average change in diameter (D) and the cumulative distribution of diameter changes (E) of persistent excitatory boutons. Persistent excitatory boutons shrink in STVE compared with dark (D; −0.125 ± 0.024 vs. −0.032 ± 0.026 μm; *P < 0.05), and the shift in distribution demonstrates decreases in the size of growing boutons and shrinking boutons (E; n = 639 boutons). F: TTX eliminates the difference in additions (17.3 ± 1.9 vs. 18.4 ± 3.7%, dark vs. STVE; P = 0.82) and subtractions (16.6 ± 3.4 vs. 12.6 ± 1.6%, dark vs. STVE; P = 0.42) of excitatory boutons with STVE (gray vs. light blue, n = 8 axons). TTX blocks the STVE-induced increase in excitatory bouton eliminations (12.6 ± 1.6 vs. 27.2 ± 2.3%, TTX+ vs. TTX−, light blue vs. dark blue; ***P < 0.0001). TTX− data are the same as in C. G: in TTX, changes in excitatory bouton diameter are comparable in dark vs. STVE (−0.037 ± 0.027 vs. −0.014 ± 0.029 μm, gray vs. light blue; P = 0.62; n = 314 boutons). TTX blocks STVE-induced shrinkage of excitatory boutons (−0.014 ± 0.029 vs. −0.125 ± 0.024 μm, TTX+ vs. TTX−, light blue vs. dark blue; **P < 0.01). TTX− data are the same as in D. H: TTX eliminates the difference in the distribution of excitatory bouton diameter changes between dark and STVE (n = 314 boutons). I and J: cumulative distribution plots of the diameter changes for all persistent excitatory boutons in the dark (I) or STVE (J) in the presence or absence of TTX. There is no difference in the distribution of diameter changes in the dark in the presence or absence of TTX (I). TTX blocks the leftward shift in diameter of shrinking excitatory boutons in STVE (J). TTX− data are the same as in E, and TTX+ data are the same as in H. Data in bar graphs are means + SE. Individual data points are presented in cumulative distribution plots. A Bonferroni correction was used for multiple comparisons.

