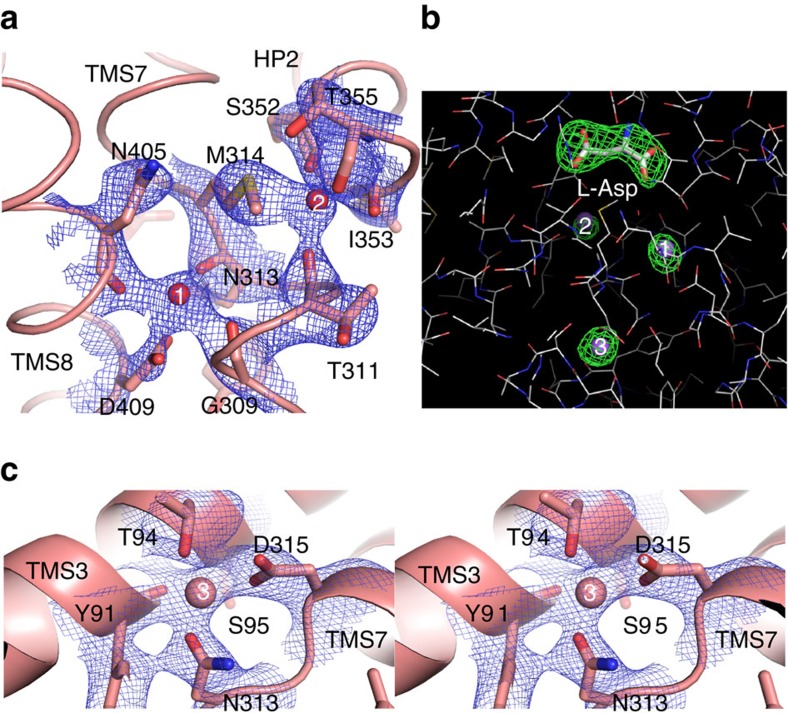
Figure 3. Structure of GltTksub sodium binding sites.
(a) Sodium binding sites Na+1 and Na+2. The residues forming the sites are shown as sticks, sodium ions as spheres. The 2fo–fc electron density is shown as blue mesh at 3σ. (b) Composite omit map (simulated annealing protocol) for the substrates L-Asp (in stick) and sodium ions (purple spheres), contoured at 3.5σ. (c) Stereo-view of Na+3 site, depicted as in a.

