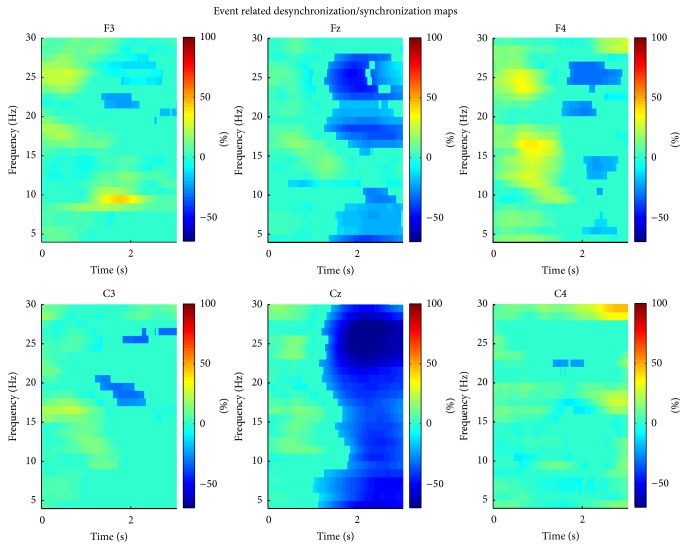
Figure 5.
Event related desynchronization maps. We decided to use channel Fz for implementation of the BCI as it displayed behaviour resembling typical ERD (i.e., decreases in the alpha and beta ranges), compared to channel Cz, which showed a decrease of power across the entire spectrum. The plots display significant changes in power as a percentage of a two-second baseline period immediately before the Go cue (t = 0). Short increases in power were associated with ocular artifacts.

