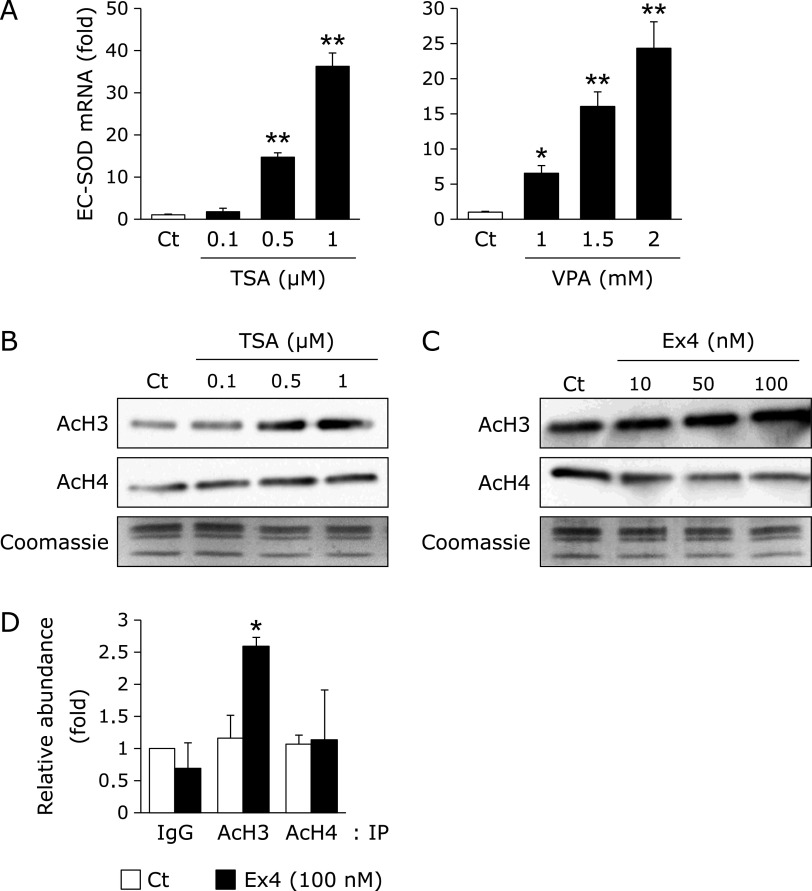
Fig. 3.
Involvement of Ex4 in histone acetylation within the SOD3 promoter region in HRECs. (A) HRECs were treated with the indicated concentrations of TSA or VPA for 24 h, followed by the measurement of EC-SOD mRNA levels. Real-time RT-PCR data were normalized using 18S rRNA levels. Data are shown as the mean ± SD (n = 3). *p<0.05, **p<0.01 vs vehicle. (B) HRECs were treated with the indicated concentrations of TSA for 24 h. After the treatment, the histones of HRECs were extracted, and this was followed by a Western blotting analysis for acetylated histone H3 (AcH3) and acetylated histone H4 (AcH4). The loading of histones was monitored by Coomassie staining. (C) HRECs were treated with the indicated concentrations of Ex4 for 24 h. After the treatment, the histones of HRECs were extracted, and this was followed by a Western blotting analysis for AcH3 and AcH4. The loading of histones was monitored by Coomassie staining. (D) HRECs were treated with 100 nM Ex4 for 24 h. After the treatment, a ChIP assay was performed as described in the Materials and methods section. Relative binding to the promoter region is expressed as the percentage amount over input (%). *p<0.05 vs vehicle (AcH3).

