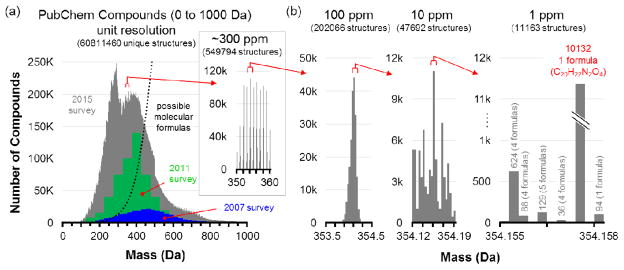
Figure 2.
An illustration of the amount of information density present at different levels of mass measurement accuracy, using the validated entries in the PubChem compound database. (a) The distribution of molecules in the PubChem compound database between 0 and 1000 Da, as surveyed in 2007, 2011, and 2015. As new compounds are discovered and archived, the distribution has shifted to lower mass, with most entries currently centered between 100 and 600 Da. Theoretical molecular formulas determined from chemical stability rules are illustrated by the dotted line, indicating that most of these entries are isomers. The inset zooms in on a 10 Da window where over half a million compounds are represented. (b) At increasing levels of mass accuracy, the number of possible molecular formulas can be reduced to a few thousand, but in one extreme case shown at 1 ppm, one formula is represented by over 10,000 isomers in the database. Mass spectrometry can significantly reduce complexity, but it cannot fully address molecular characterization without other dimensions of information. Reproduced with permission of Annual Review of Analytical Chemistry, Volume 9 © by Annual Reviews, http://www.annualreviews.org from reference [2].

