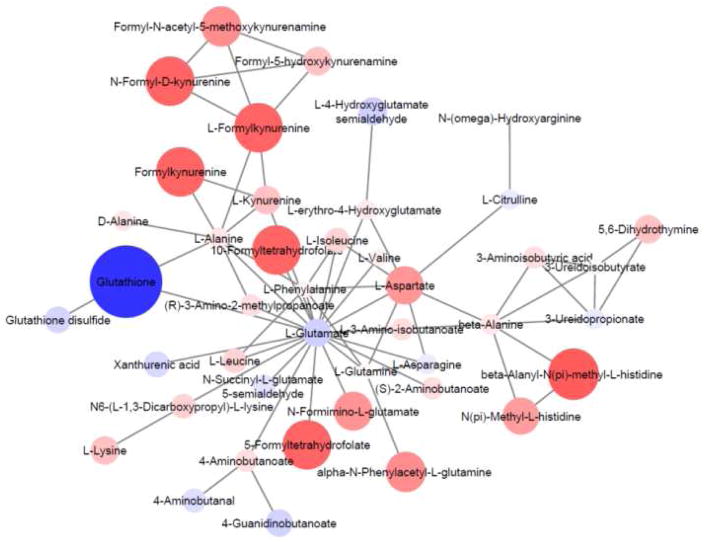
Figure 4.
Network module output from mummichog analysis of the qualitative and relative quantitative differences in metabolomic profiles of G6PDd deficient vs. normal human erythrocytes. Feature m/z values and significance measurements were used to predict metabolic activity networks without the use of conventional MS/MS identification workflows. Metabolites are colored blue (negative fold change) or red (positive fold change) and the size/color intensity represents the magnitude of fold change.

