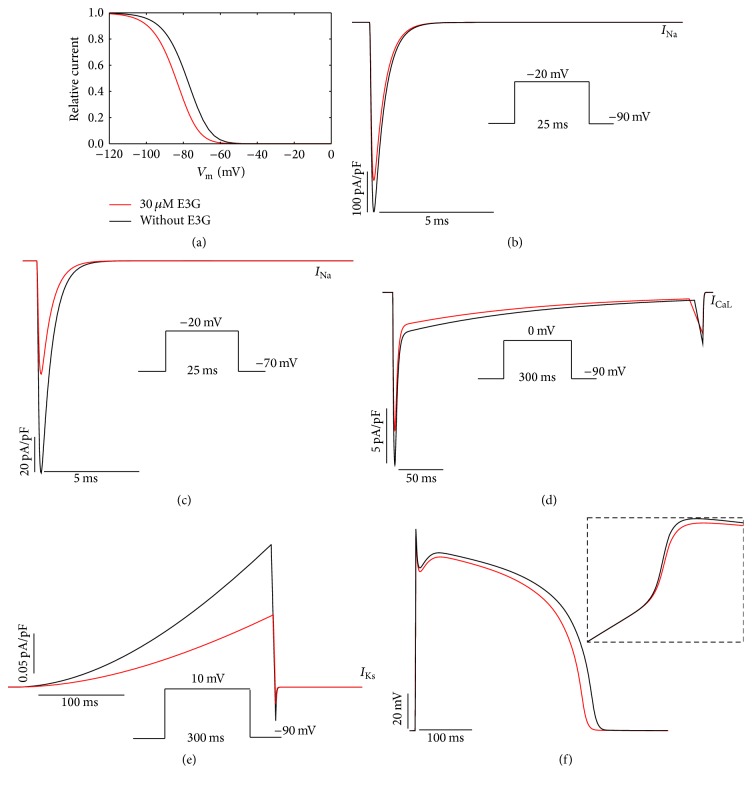
Figure 2.
Simulated effects of 30 μM E3G in the human ventricular model (TNNP [Tusscher–Noble–Noble–Panfilov]). (a) Steady state inactivation curves (h ∞) in the presence or absence of E3G. (b) and (c) Inhibitory effect of E3G on the sodium current at −90 mV and −70 mV resting potentials. (d) Inhibitory effect of E3G on the calcium current (20% inhibition). (e) Inhibitory effect of E3G on the I Ks current (50% inhibition). (f) E3G effect on the midmyocardial action potential (intensity of stimulus = 52 μA/μF, duration: 1 ms; inset, zoom of the rapid depolarization phase). For all panels, black lines: without E3G; red lines: 30 μM E3G.

