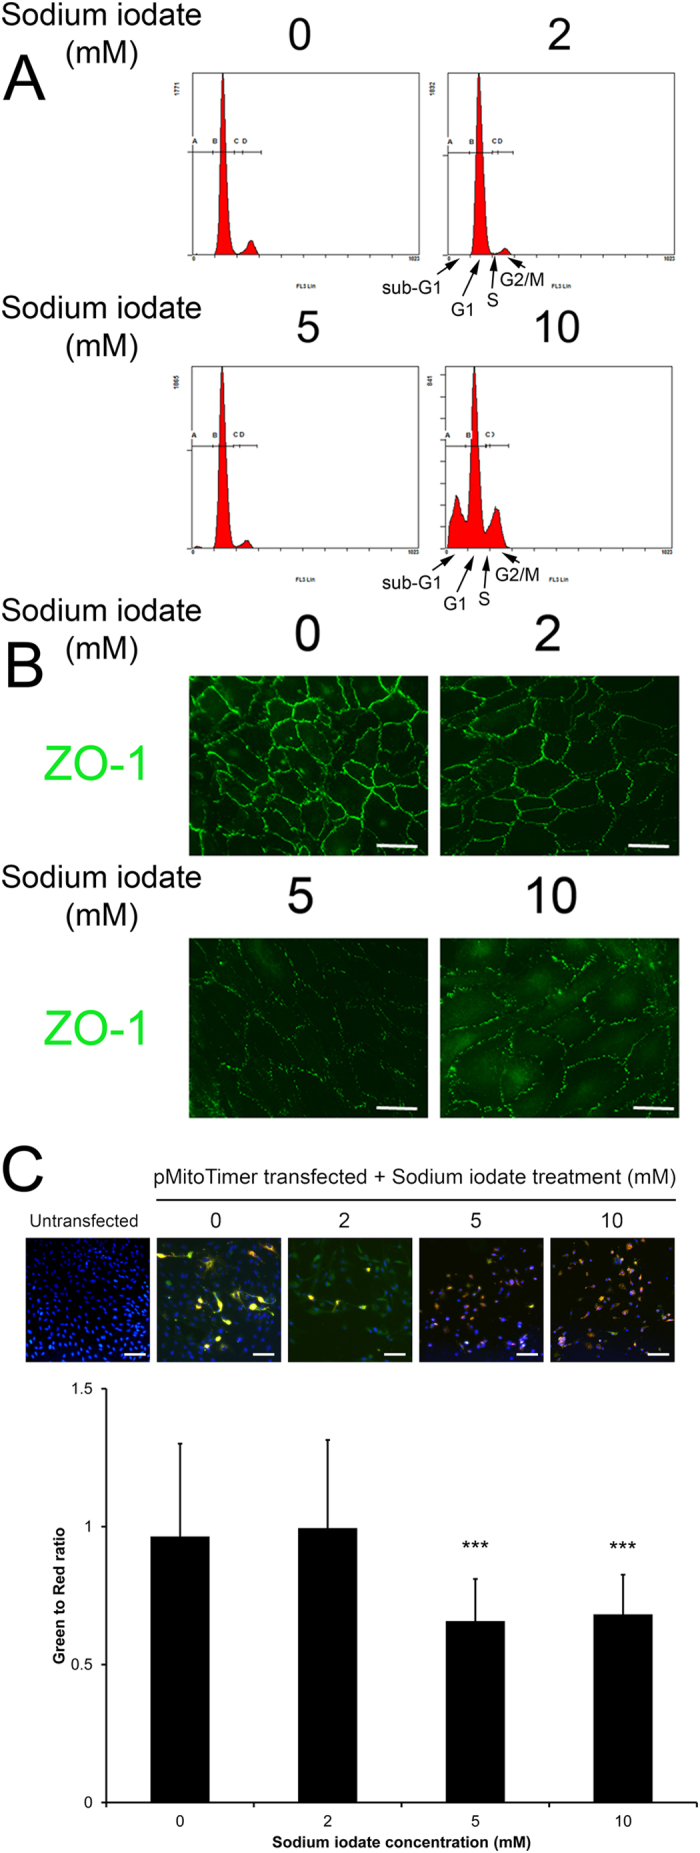
Figure 2. The effect of sodium iodate on RPE cell cycle, cell integrity and mitochondrial oxidative status.

(A) Cell cycle analysis was evaluated by propidium iodide staining and flow cytometry analysis. There was significant increase in sub-G1 and decrease in G1 populations in the 10 mM treatment group compared to the control group. A: sub-G1 phase; B: G1 phase; C: S phase; D: G2/M phase. (B) RPE cell integrity was determined by immunofluorescence analysis of tight junction protein (ZO-1; green). The expression of ZO-1 was dose-dependently inhibited with increasing concentrations of sodium iodate. Scale bars: 50 μm. (C) Mitochondrial oxidative stress analysis by MitoTimer reporter in sodium iodate-treated ARPE-19 cells. Fluorescence was shifted from green to red when mitochondria were oxidized. RPE cells with 5 and 10 mM sodium treatments were more oxidized compared to 2 mM and the control group. Blue: DAPI (nuclei). Scale bars: 50 μm. ‘***’p < 0.001.
