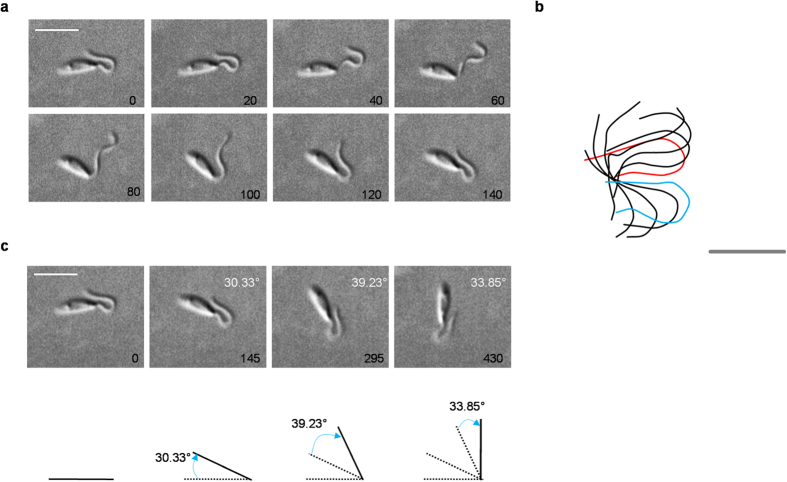
Figure 4. Ciliary (base-to-tip) waveform in LRP reactivated L. donovani in presence of 0.5 μM cAMP.
(a) A montage of stills showing one complete ciliary beat of a LRP reactivated cell (Beat frequency = 6.89 Hz) with 0.5 μM cAMP taken from video 7. Camera exposure was 5 milliseconds (ms) however, we displayed the images taken after every 20 ms. Time intervals (ms) are shown on bottom right. Bar, 10 μM. Images were taken as representatives of cells that were quantified and summarized in Table 2. (b) Ciliary waveforms of ‘a’ were tracked and superimposed using BohBohSoft. Red and blue lines correspond to first track and last track of the beat cycle respectively. Bar, 5 μm. (c) Upper panel shows stills of the cell orientation at the beginning of 4 consecutive beat cycles. The degree of change in direction per beat are shown on top right (white). Bar, 10 μm. Bottom panel displays a line drawing representation of corresponding stills above. Solid line denotes present position of the cell. Dotted line denotes previous position(s). Blue arrow represents the angle by which the cell reorients itself in one beat cycle.

