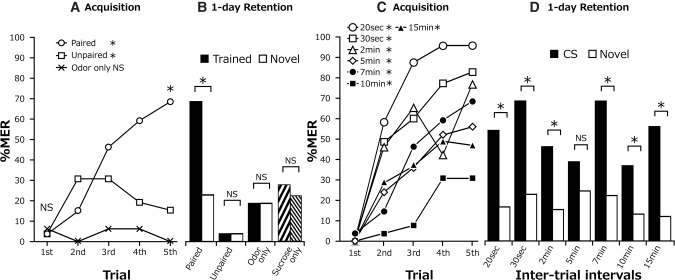
Figure 2.
Evaluation of the pairing-specific effect (A,B) and the effect of ITIs (C,D) in five-trial conditioning. (A) Acquisition performances of the paired group, unpaired group, odor-only group, and sucrose-only group in five-trial conditioning with 7-min ITIs. Percentages of MERs to the odor are shown for the former three groups. The paired and unpaired groups exhibited significant increases in percentages of MERs with increase in the number of trials, but the odor-only group did not (Cochran's Q test: unpaired: n = 26, P = 0.046, χ2 = 9.67; odor only: n = 16, P = 0.76, χ2 = 2). Percentages of MERs did not significantly differ among the groups in the first trial (LR test: P = 0.91, deviance = 0.18, df = 2) but significantly differed in the fifth trial (LR test: P = 1.0 × 10⁻⁹, deviance = 41.43, df = 2; Fisher's exact test: paired group vs. odor-only group: P = 4.7 × 10⁻⁷, odds ratio = Inf.; unpaired vs. odor only: P = 0.27, odds ratio = Inf.). (B) One-day retention after five-trial conditioning with 7-min ITIs. Percentages of MERs to the CS (black bar) and to a novel odor (white bar) were compared in the paired, unpaired, and odor-only groups (McNemar's test: paired group; P = 1.63 × 10⁻⁵, χ2 = 18.58; unpaired, P = 1, χ2 = 0; odor only, P = 1, χ2 = 0). In the sucrose-only group, percentages of MERs to two novel odors, rose (left down shaded bar) and orange (right down shaded bar) odors, were compared (McNemar's test: P = 1, χ2 = 0). The percentage of MERs to the trained odor in the paired group, but not in the odor-only group, was significantly higher than that in the unpaired group (LR test: P = 2.23 × 10⁻⁹, deviance = 39.84, df = 2; Fisher's exact test: paired vs. unpaired: P = 2.24 × 10⁻⁸, odds ratio = 0.019; unpaired vs. odor only: P = 0.15, odds ratio = 0.18). (C) Acquisition performance after five-trial conditioning with different ITIs. Percentage of MERs to the CS increased with the progress of training in all groups (Cochran's Q test: 20 sec, n = 24, P = 0.00018, χ2 = 14; 30 sec, n = 35, P = 3.74 × 10⁻⁵, χ2 = 17; 2 min, n = 24, P = 0.00053, χ2 = 12; 5 min, n = 49, P = 4.16 × 10⁻⁸, χ2 = 40.09; 7 min, n = 54, P = 4.70 × 10⁻¹⁵, χ2 = 73.24; 10 min, n = 38, P = 1.78 × 10⁻⁵, χ2 = 27.23; 15 min, n = 25, P = 2.07 × 10⁻⁵, χ2 = 26.92). Percentage of MERs in the fifth trial of the 10-min group was compared with those of other groups (LR test: P = 1.14 × 10⁻⁷, deviance = 43.05, df = 6; Fisher’s exact test: 20 sec vs. 10 min: P = 1.37 × 10⁻⁶, odds ratio = 14.01, 30 sec vs. 10 min: P = 0.00012, odds ratio = 14.01; 2 min vs. 10 min: P = 0.0019, odds ratio = 7.16; 5 min vs. 10 min: P = 0.23, odds ratio = 1.84; 7 min vs. 10 min: P = 0.0018, odds ratio = 4.79; 15 min vs. 10 min: P = 0.092). (D) One-day retention performance after five-trial conditioning with different ITIs. Percentage of MERs to the CS was significantly greater than that to a novel odor in all groups except for the 5-min ITI group (McNemar's test; 20 sec, n = 24, P = 0.016, χ2 = 5.82; 30 sec, n = 35, P = 0.00041, χ2 = 12.5; 2 min, n = 26, P = 0.027, χ2 = 4.9; 5 min, n = 49, P = 0.07, χ2 = 3.27; 7 min, n = 54, P = 1.63 × 10⁻⁵, χ2 = 18.58; 10 min, n = 38, P = 0.04, χ2 = 4.27; 15 min, n = 25, P = 0.0055, χ2 = 7.69). Percentages of MERs to the CS significantly decreased from the fifth trial to the 1-d retention test in the 20-sec and 2-min groups but not in other groups (McNemar test: 20 sec: P = 0.0094, χ2 = 6.75; 30 sec: P = 1, χ2 = 0; 2 min: P = 0.0027, χ2 = 4.9; 5 min: P = 0.48, χ2 = 0.5; 7 min: P = 1, χ2 = 0; 10 min: P = 0.72, χ2 = 0.13; 15 min: P = 1, χ2 = 0) (*) P < 0.05, NS: P > 0.05.

