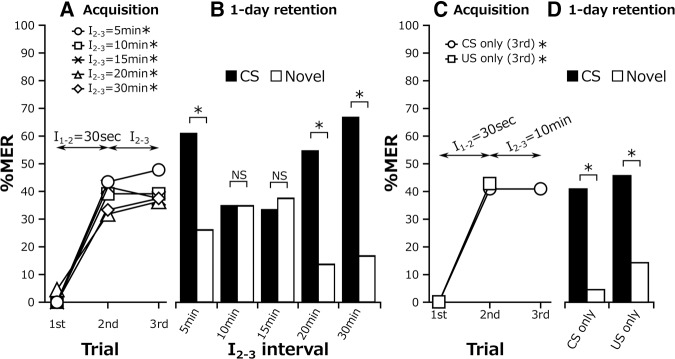
Figure 8.
Acquisition and 1-d retention after three-trial conditioning with 30-sec I1–2 and different I2–3 (A,B) and after two pairing trials with a 30-sec interval (I1–2) and subsequent presentation of CS or US alone with a 10-min interval (I2–3) (C,D). (A) Acquisition performance. The change in percentages of MERs to the CS with progress of training was statistically evaluated (Cochran's Q test: 5-min I2–3, n = 23, P = 0.00019, χ2 = 17.08; 10-min I2–3, n = 23, P = 0.0045, χ2 = 10.8; 15-min I2–3, n = 24, P = 0.0047, χ2 = 10.71; 20-min I2–3, n = 22, P = 0.0084, χ2 = 9.56; 30-min I2–3, n = 24, P = 0.0023, χ2 = 12.17). (B) One-day retention performance. The percentage of MERs to the CS was statistically compared with that to a novel odor in each group (McNemar's test: 5-min I2–3, n = 23, P = 0.027, χ2 = 4.9; 10-min I2–3, n = 23, P = 1, χ2 = 0; 15-min I2–3, n = 24, P = 1, χ2 = 0; 20-min I2–3, n = 22, P = 0.0077, χ2 = 7.11; 30-min I2–3, n = 24, P = 0.0015, χ2 = 10.08). (C) Acquisition performance after two pairing trials with a 30-sec interval (I1–2) and subsequent presentation of CS or US alone with a 10-min interval (I2–3). The percentage of MERs in the first trial was statistically compared with that in the second trial in each group (Cochran's Q test: CS only, n = 22, P = 0.002, χ2 = 12.46; US only, n = 35, P = 3.06 × 10⁻⁷, χ2 = 30.0). (D) One-day retention performance. The percentage of MERs to the CS was statistically compared with that to a novel odor in each group (McNemar's test: CS only, n = 22, P = 0.027, χ2 = 4.9; US only, n = 35, P = 0.0055, χ2 = 7.69). (*) P < 0.05, NS: P > 0.05.

