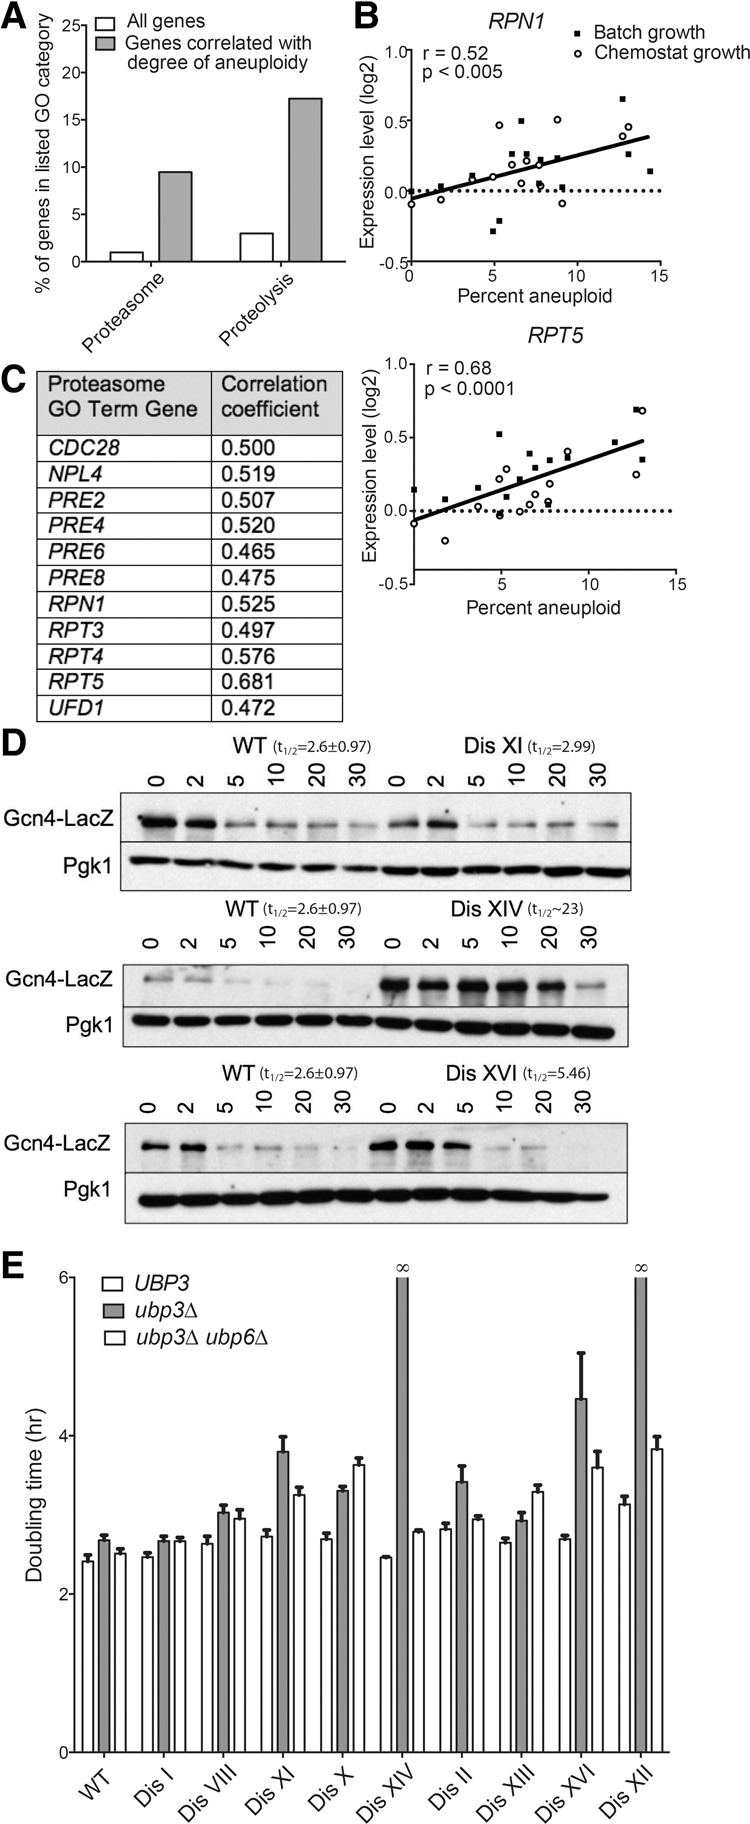
Figure 6.

Disomic yeast strains show impaired protein degradation and up-regulate proteasome gene expression. (A) The percentages of the genes whose expression correlates with the degree of aneuploidy (dark gray) and the percentages of all genes across the genome (white) that belong to the gene ontology (GO) term categories “proteasome” and “proteolysis” are plotted. (B) The relative expression levels of proteasome component genes RPT5 and RPN1 in disomic strains grown in either batch culture or chemostats are plotted against the percent aneuploidy of each strain (number of disomic ORFs/total number of yeast ORFs). Data are from Torres et al. (2007). Linear regression values are shown. (C) Genes belonging to the GO term category “proteasome” whose expression is correlated with the degree of aneuploidy are listed along with the correlation coefficient for each gene. (D) The experiment was performed as described for Figure 5, A–F. Western blots show degradation of Gcn4-LacZ in wild type and three disomes. Pgk1 was used as a loading control. (E) Doubling times of the indicated strains were determined as described in Figure 1.
