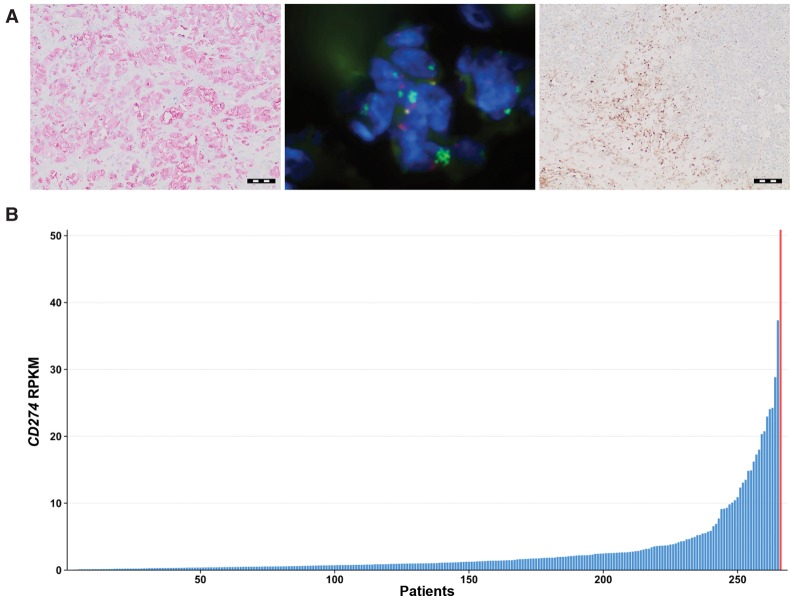
Figure 2.
PDL1 protein expression, PDL1 amplification, peritumoral lymphocyte infiltration, and PDL1 mRNA expression in a patient with anaplastic cancer of unknown primary. (A) (Left) Photomicrograph showing PDL1 protein expression in a metastasis (scale bar, 100 µm); (middle) representative fluorescence in situ hybridization signal pattern showing amplification of the PDL1 locus (green signals) relative to the centromere of Chromosome 9 (red signals); (right) CD4 lymphocyte staining (scale bar, 200 µm). (B) Ranking of 266 patient samples analyzed in the NCT MASTER study according to PDL1 (CD274) mRNA levels, as determined by RNA-seq. The red bar indicates the described index patient. RPKM, reads per kilobase of exon model per million mapped reads.

