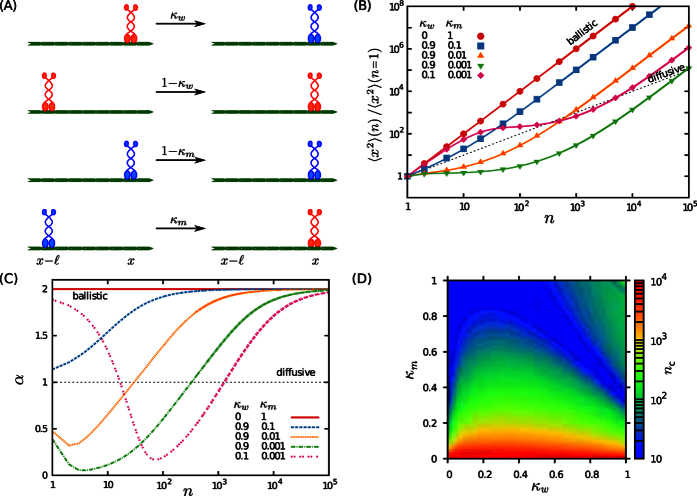
Figure 1. Motion on a single filament.
(A) A schematic of the transition probabilities between pause (blue) and motion (red) states of a motor protein along a single cytoskeletal filament, as described by the set of master equations (1). The four possibilities for the motility states of two successive steps are shown separately. (B) MSD as a function of the step number n for λ = 1,  , and several values of κm and κw. The solid lines are obtained from the analytic expression (S17) and the symbols represent Monte Carlo simulation results. (C) Temporal evolution of the anomalous exponent α via Eq. (5), for the same parameters as in panel (B). (D) The crossover time nc to the asymptotic ballistic motion for λ = 1 and
  in the (κw, κm) phase space.

