
Figure 1. Simulation of 2D structured illumination with fluorescent beads.

(a) Wide-field image. (b) ISIM reconstruction. (c) Logarithm of the ISIM power spectrum: 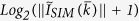 . (d) Cross-correlations of extended domains with the central one,
 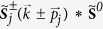 , produce a sharp peak due to their information overlap. The peak provides an estimate of the reconstruction parameter
  . The regions where the peak appears are enclosed in the white box, top left corner insets show zooms of those regions.