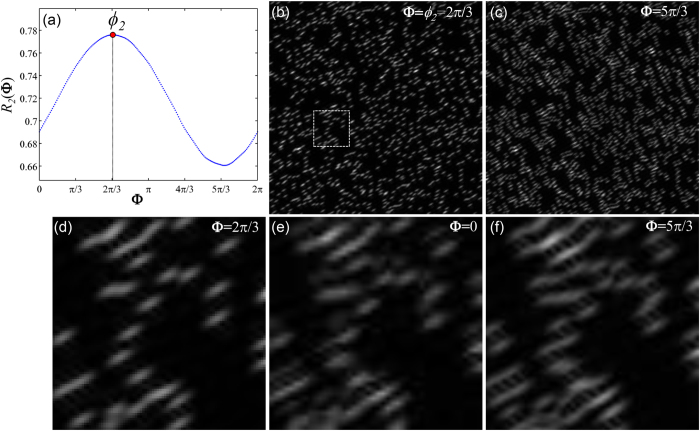
Figure 2. Estimation of initial phase ϕj by correlating the reconstruction ISIM,j and the wide-field.
(a) The R2(Φ) curve provides the values of the normalized cross-correlation between the wide-field and the reconstruction ISIM,2 at different phases from 0 to 2π. Arguments of the maximum and minimum of the curve respectively determine the best and worst estimates of the initial phase. ISIM,2 reconstruction with (b) 2π/3 and (c) 5π/3. Taking the former as reference it is clear that the latter is full of artifacts. Magnifications of the area within the white rectangle: Reconstructions using different initial phase values (d) 2π/3, (e) 0 and (f) 5π/3. The degradation of the reconstruction seems gradual, from the best result in (d), then to a stage of moderate artifact occurrence in (e) and finally severe distortions in (f).

