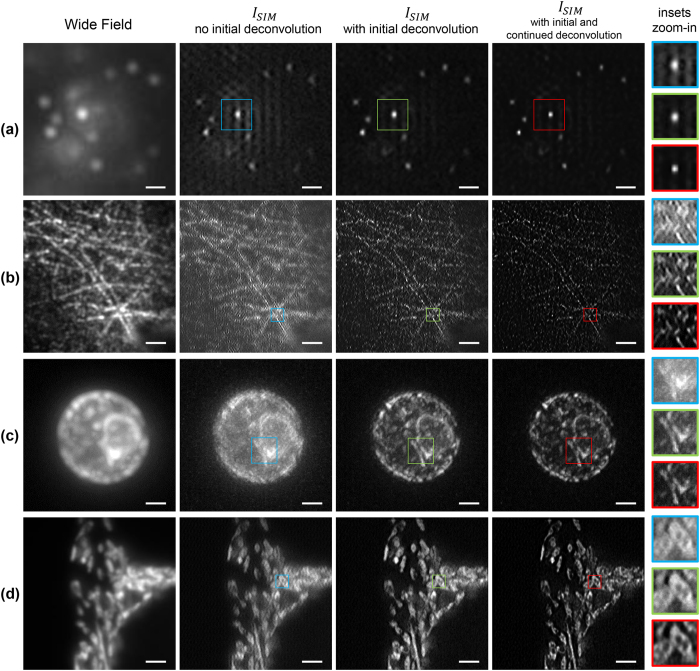
Figure 3. Comparison of SIM image reconstruction of different samples with/without the initial and continued deconvolution steps.
All samples are excited with a 488 nm laser, while a bandpass filter (FF02-525/50-25, Semrock) is used in the detection path. (a) Fluorescent beads are 40 nm (F8759, Invitrogen) in diameter. (b) HUVE cells with α-tubulin immuno-stained with Alexa 488. (c) Maximum intensity projection of a 7 μm image stack of a living wild type yeast cell (BY4741, transformed with pRS415‐ERsfGFP‐HDEL)11. The endoplasmic reticulum is GFP-tagged and the sample is embedded in 1.5% low melt agarose. (d) Hepatocellular carcinoma cells (HepG2 cell line) on a coverslip expressing GFP in mitochondria. The period of the illumination patterns in (a,d) is around 300 nm and, 215 nm and 240 nm for (b,c) respectively. In each reconstruction, a region was selected and enclosed in a color box. Magnifications of these regions are displayed in the rightmost column. Scale bar: 2 μm except for (a) 600 nm.

