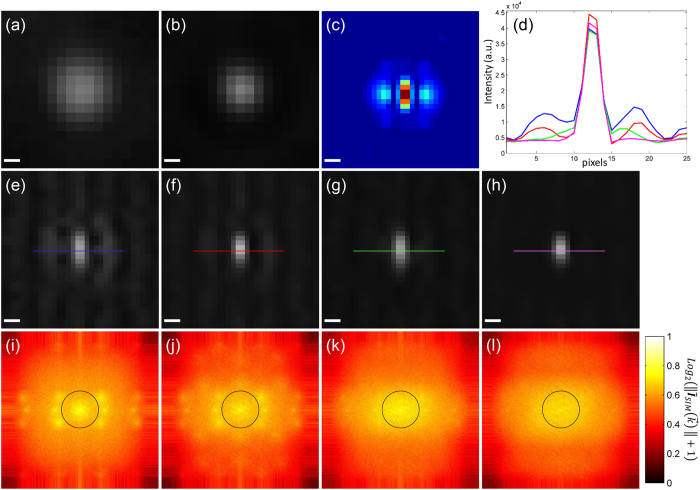
Figure 6. Continued deconvolution improves the reconstructed image ISIM.
A single bead taken from a larger image consisting of 40 nm fluorescent beads is selected to show the effects of the initial and continued deconvolution on the reconstruction. (a) Wide-field, (b) deconvolved wide-field and (c) PSFSIM. Reconstructions (e) without initial nor continued deconvolution, (f) without initial but with continued deconvolution, (g) with initial but without continued deconvolution, (h) with initial and continued deconvolution. Their corresponding spectra are shown respectively in (i–l). A black circle in the spectra outlines the rim of the OTF. Seven spots stand out in (i,j) corresponding to the centers of the extended and central domains. This prominence generates unequal spectra and side lobes in the reconstructed bead. The continued deconvolution equalizes the spectrum generating correct reconstructions. The effects of the initial and continued deconvolutions are summarized in the intensity profiles in (d). The reconstruction with initial and continued deconvolution eliminates the side lobes effectively (magenta solid line). Scale bar: 100 nm. Pixel size: 28.8 nm.

