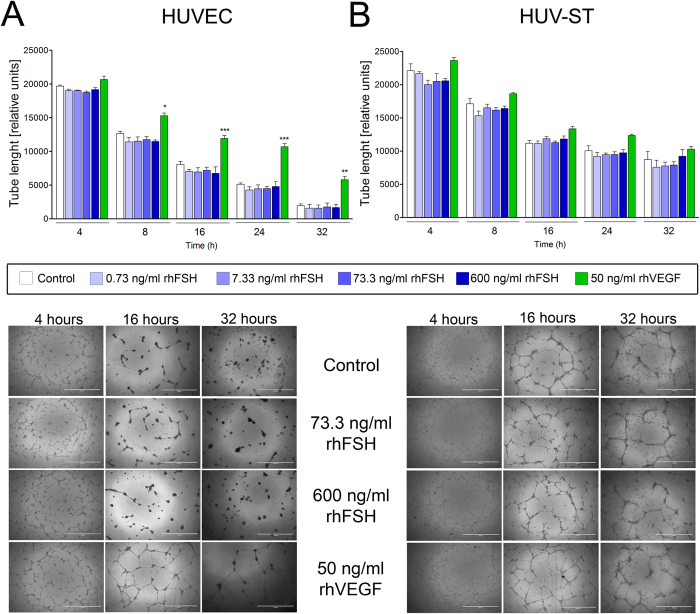
Figure 4.
Tube formation of HUVECs (A) and HUV-ST (B) cells. Cells seeded on reduced growth factor basement membrane matrix were stimulated without or with 0.733, 7.33, 73.3 and 600 ng/ml of rhFSH, or 50 ng/ml of rhVEGF used as a positive control. Pictures taken after 4, 8, 16, 28 and 32 h and total tube length was measured by Angiogenesis Analyzer for ImageJ software and selectively confirmed manually. Each bar represents the mean ± SEM of three independent experiments with n = 5 per treatment. Asterisks indicate differences between control and stimulated cells (*P < 0.05, **P < 0.01, ***P < 0.001).

