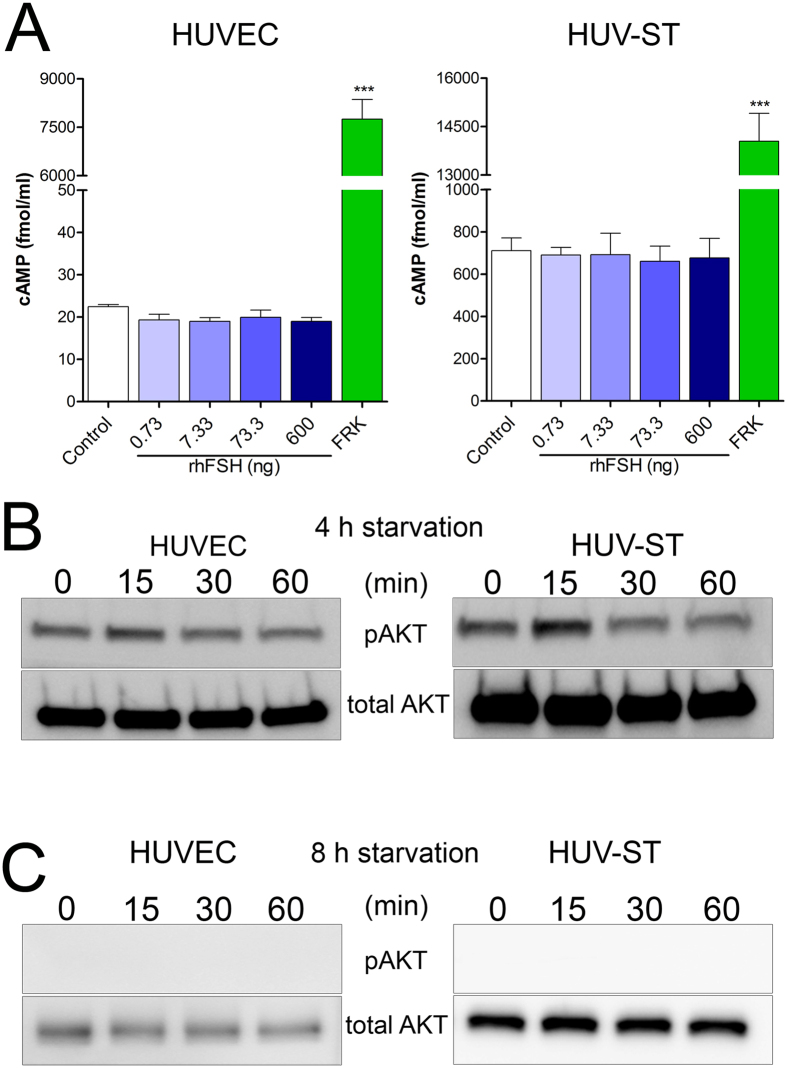
Figure 6.
Production of total cAMP (A) and phosphorylation of AKT (B) in HUVECs and HUV-ST cells. cAMP was measured in medium collected from HUVEC and HUV-ST cells after 1 h incubation without or with 0.733, 7.33, 73.3, and 600 ng/ml of rhFSH, or 10 μM forskolin used as a positive control. Each bar represents the mean ± SEM of three independent experiments with n = 4 per treatment. Asterisks indicate differences between control and stimulated cells (***P < 0.001). Middle (B) and Lower (C) panels present the phosphorylation of AKT (pAKT) in HUVECs and HUV-ST cells. Cells starved for either 4 (B) or 8 h (C) were stimulated with 600 ng/ml of rhFSH for 15, 30 and 60 minutes. A representative picture of cropped gel has been shown here, full-length blots/gels are presented in Supplementary information file.

