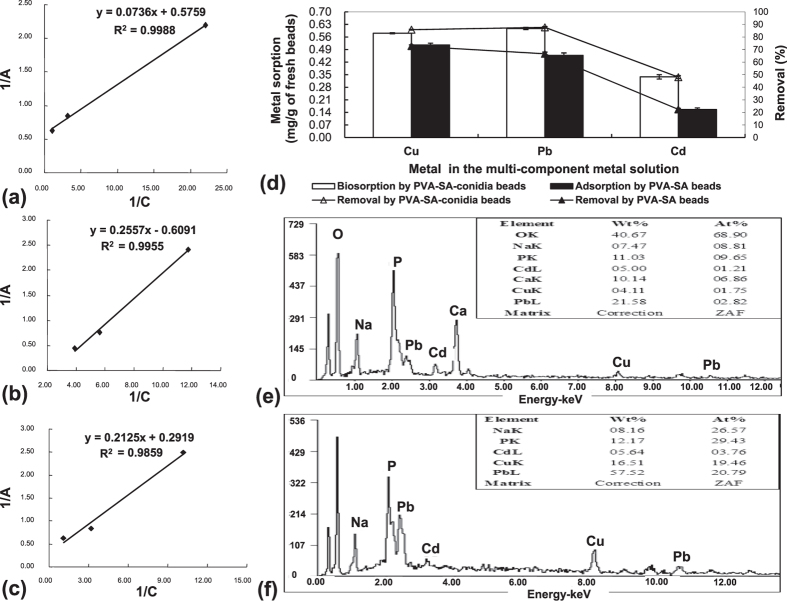
Figure 6.
The Langmuir isotherm fitting results for biosorption of Cu (a), Pb (b) and Cd (c) by the PVA-SA-conidia beads, respectively; metal sorption and removal from the multi-component metal solution (d); and energy spectra of control PVA-SA beads (e), and PVA-SA-conidia beads after biosorption (f), respectively. The Langmuir isotherms were constructed with the data from results of Figs 1(a–c), 2(a–c) and 3(d–f). In (a–c), A on the Y axis represents the biosorption amount (mg) when biosorption reached equilibrium. C on the X axis indicates the final metal concentration in the solution when biosorption reached equilibration. To determine the metal sorption and removal from the multi-component metal solution, and to detect energy spectra of the beads, the beads were pre-cultured for 48 h by shaking at 200 rpm in LPD and then fully rinsed by sterilized water before sorption. The sorption was conducted in the solution of unadjusted natural pH, and containing 5 g beads of a 3.2 mm diameter and 70 mg/L for each Cu, Pb and Cd by shaking incubation for 3 h at 200 rpm at 32 °C. Each datum in the Figure was the average mean ± SD from three independent experiments. The energy spectrum from the beads was recorded by the EDXS. EDXS, energy dispersive X-ray spectroscopy. LPD, liquid potato dextrose. PVA, polyvinyl alcohol. SA, sodium alginate. SD, standard deviation.

