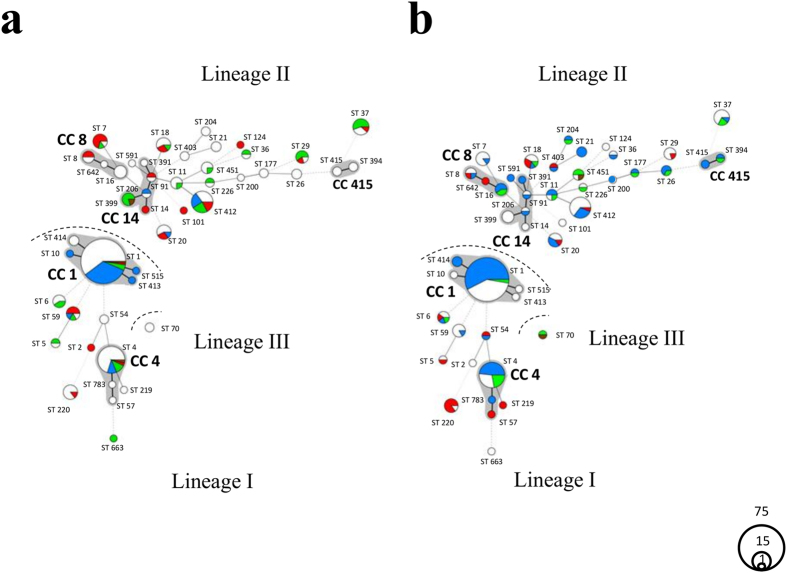
Figure 1. Minimum spanning tree (MST) of 248 L. monocytogenes isolates based on multilocus sequence typing (MLST) analysis.
Circles represent sequence types (STs) and their size corresponds to the number of isolates present in each ST. The lines between different STs represent phylogenetic relationships, bold lines indicate one mismatch in the seven housekeeping genes, plain lines two mismatches, discontinuous lines three mismatches and light discontinuous lines four or more mismatches. Grey zones surrounding multiple STs, represent clonal complexes (CCs), which contain STs with a single mismatch in the seven loci. The three evolutionary lineages are indicated. Isolates of ruminant rhombencephalitis cases are represented in blue (n = 140), non-encephalitic ruminant clinical cases in red (n = 47), ruminant faecal isolates in brown (n = 5) and isolates of the ruminant farm environment in green (n = 56). (a) MST of cattle isolates. Isolates of rhombencephalitis cases are represented in blue (n = 39), non-encephalitic cattle clinical cases in red (n = 28), cattle faecal isolates in brown (n = 3), isolates of their environment in green (n = 33) and small ruminant-associated isolates in white (n = 145). (b) MST of small ruminant isolates. Isolates of rhombencephalitis cases are represented in blue (n = 101), non-encephalitic clinical cases in red (n = 19), faecal isolates in brown (n = 2), isolates of their environment in green (n = 23) and cattle-associated isolates in white (n = 103).

