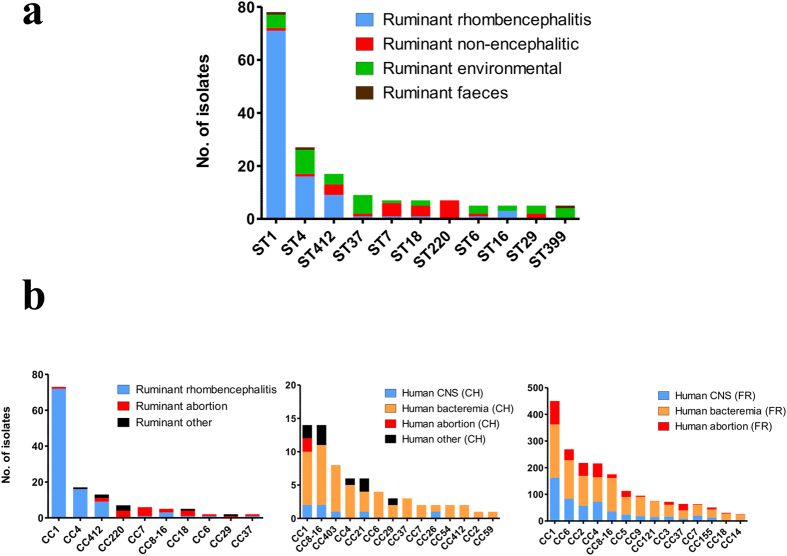
Figure 2. Frequency of L. monocytogenes isolates according to their source of isolation in the most prevalent sequence types (STs) and clonal complexes (CCs).
(a) Non-homogeneous distribution of STs in ruminant-associated isolates. The 11 most prevalent STs are arranged according to their abundance. Blue = ruminant rhombencephalitis (n = 134), red = ruminant non-encephalitic infections (n = 27), green = ruminant-associated environment (n = 40), brown = faeces (n = 4). (b) Divergent distribution of CCs in ruminant (left) and human clinical isolates from Switzerland (CH, middle)40 and France (FR, right)7. Blue = ruminant rhombencephalitis/human central nervous system (CNS) isolates, red = abortions, black = other infection sources, orange = human bacteremia.

