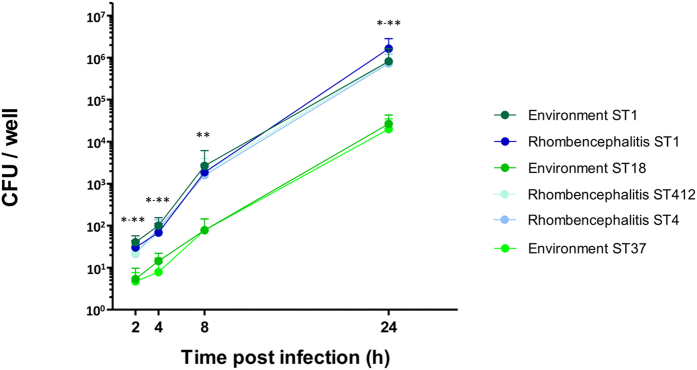
Figure 3. CFUs per well of six isolates in the bovine macrophage (BoMac) cell line.
CFUs were enumerated from cell lysates at indicated time points post infection, three independent experiments were performed in triplicates. Error bars indicate 95% SEM. *p-value < 0.05 (2 h: ST1 rhombencephalitis VS. ST18 and ST37; 4 h: ST1 environment and ST4 Vs. ST18, ST1 rhombencephalitis and ST412 Vs. ST37; 24 h: ST1 Vs. ST18, ST4 Vs. ST37), **p-value < 0.01 (2 h: ST1 environment VS. ST18 and ST37; 4 h: ST1 environment and ST4 Vs. ST37; 8 h: ST1 and ST4 Vs. ST18 and ST37; 24 h: ST1 Vs. ST37).

