
Figure 6. Proportion of total IBD sharing between Druze and different populations.
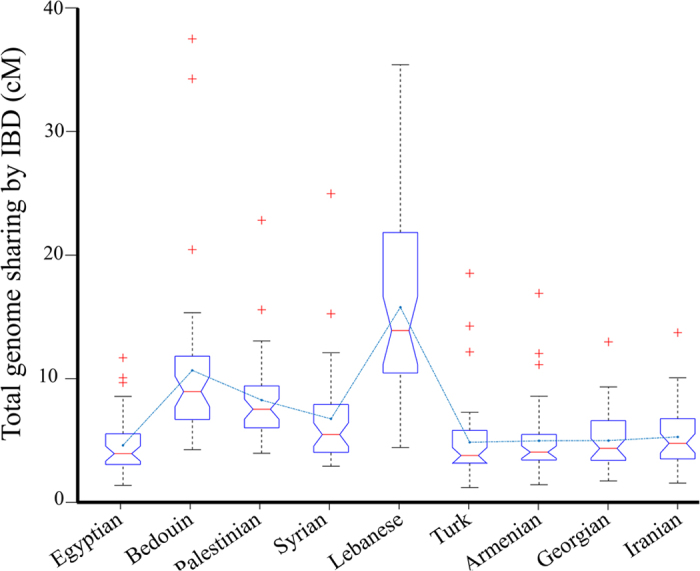
The maximal IBD between each Druze and an individual from each population are summarised in box plots. Lines pass through the mean values.
Official websites use .gov
A
.gov website belongs to an official
government organization in the United States.
Secure .gov websites use HTTPS
A lock (
) or https:// means you've safely
connected to the .gov website. Share sensitive
information only on official, secure websites.
The maximal IBD between each Druze and an individual from each population are summarised in box plots. Lines pass through the mean values.