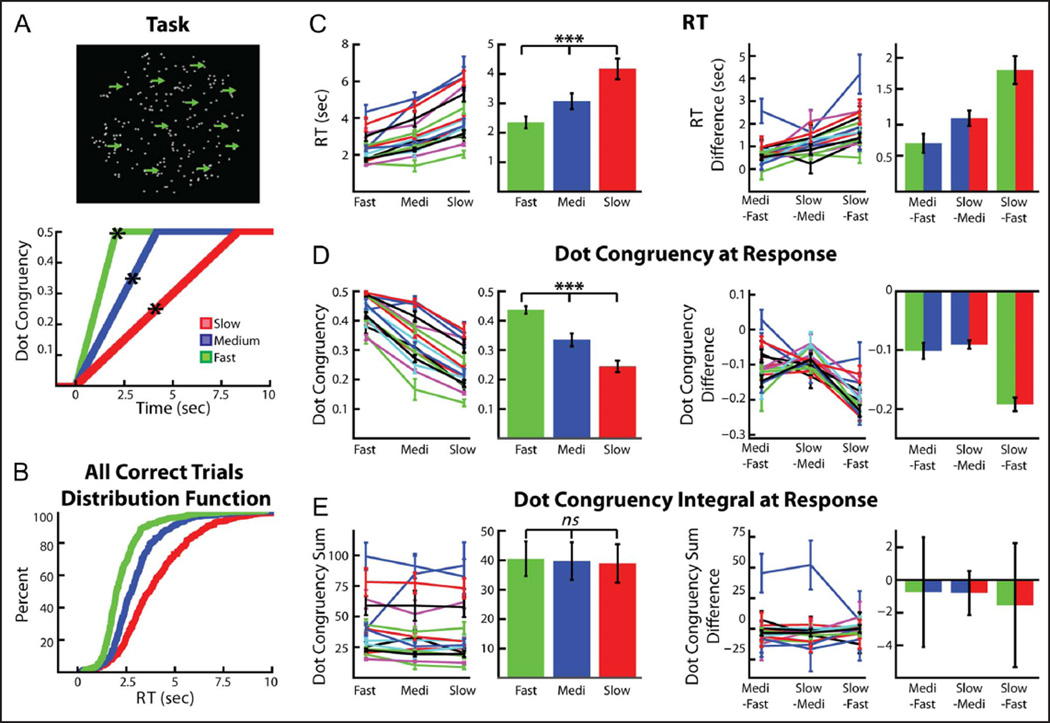
Figure 1.
Task and behavior. (A, top) Randomly moving dots were displayed continuously on screen. During all trials, dots began moving coherently in one horizontal direction until either 50% of the dots moved coherently, the participant indicated the direction he or she perceived the dots were moving in, or the trial timed out after 14 sec. (A, bottom) Three trial types were used, with the only difference between trials being the rate at which the dots became increasingly congruent. Asterisk denotes average RT for each trial type. (B) Cumulative distribution function (CDF) of the RTs for all of the fast (green), medium (blue), and slow (red) trials (collapsed across all participants) used in the analysis. (C) Mean RTs for the three conditions were significantly different. Left two panels show each trial type’s average RT for each participant (mean ± SEM) as well as the average RT across participants (mean ± SEM). Right two panels show the difference between trial types for each participant (mean ± standard error of the difference, SED) and the average across participant difference (mean ± SEM). (D) On average, participants responded with a lower instantaneous dot congruency (and thus a higher level of stimulus ambiguity) in the slow trials, followed by the medium trials and then the fast trials. Format as in C. (E) The integral of instantaneous dot congruency (from congruent motion onset until the response) was equal for all three conditions. Format as in C. ***p < .0001.

