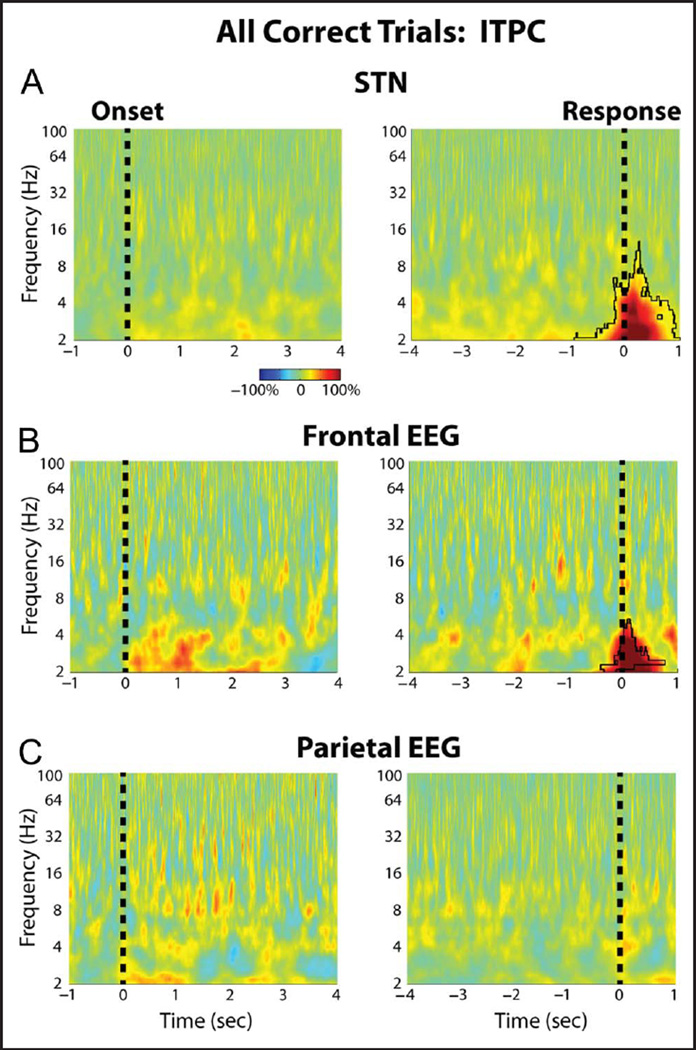
Figure 3.
Group average percentage chance in STN LFP and cortical EEG ITPC. (A) STN LFP ITPC changes averaged across all three trials are shown aligned to the congruent dot motion onset (left) and to the response (right). Black outline denotes time–frequency clusters determined to be significantly different from baseline (p = .001, permutation testing). The baseline was chosen to be a 1-sec long time period between trials during which all dots moved randomly in any direction. (B) Same as A but for the FCz-Cz frontal cortical electrode (p = .006, for the response aligned data, permutation testing). (C) Same as A but for the Pz-Cz parietal cortical electrode. There were no significant differences in ITPC between the different trial types.

