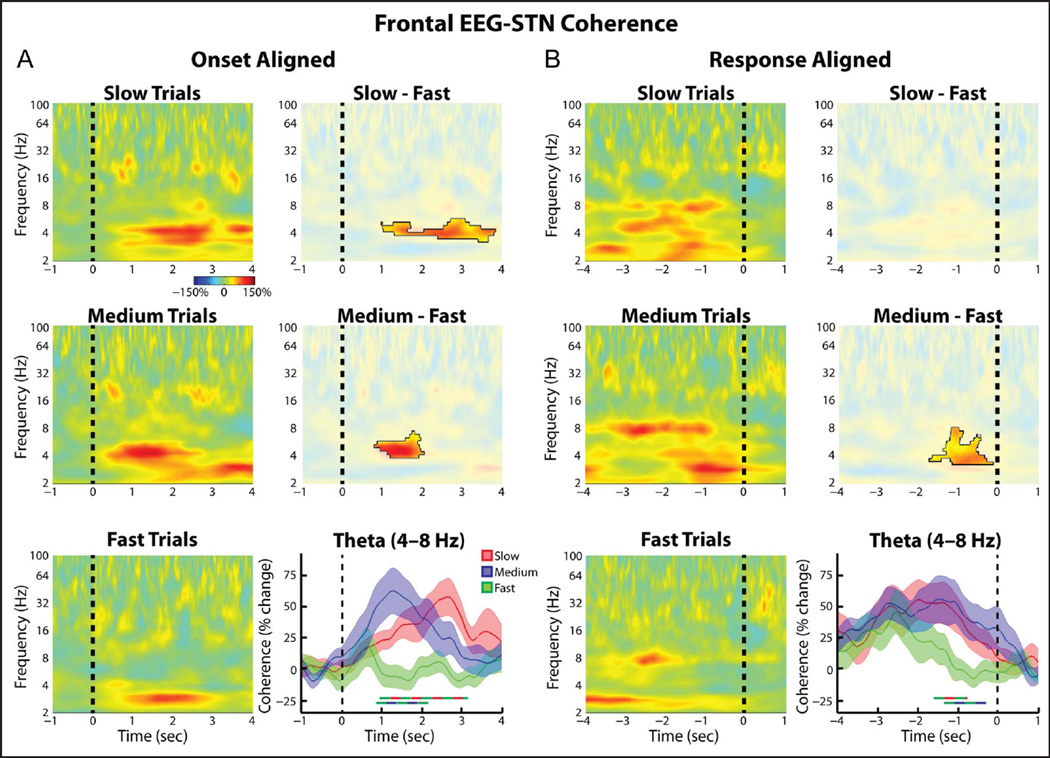
Figure 4.
Group average normalized changes in (frontal EEG)–STN LFP wavelet coherence. (A, left) Coherence spectrogram for the slow (top), medium (middle), and fast (bottom) trials. Changes were found relative to a 1-sec long time period between trials during which all dots moved randomly in any direction. (A, right). Differences between slow and fast trials were significant (top, p = .023, permutation testing, unmasked area) as were those between the medium and the fast trials (middle, p = .031). Time series of percent change in theta band (4–8 Hz) coherence are also shown (bottom, mean ± SEM), with thick lines denoting significant time points between two trial types (color of line indicates which two trial types were compared, p = .003 for slow vs. fast comparison, p = .004 for medium vs. fast comparison, permutation testing). (B) Same as A but for response aligned data. (B, bottom right) Both slow and medium trials showed significantly higher theta coherence in the second preceding the response (p = .039 for slow vs. fast comparison, p = .009 for medium vs. fast comparison, permutation testing).

