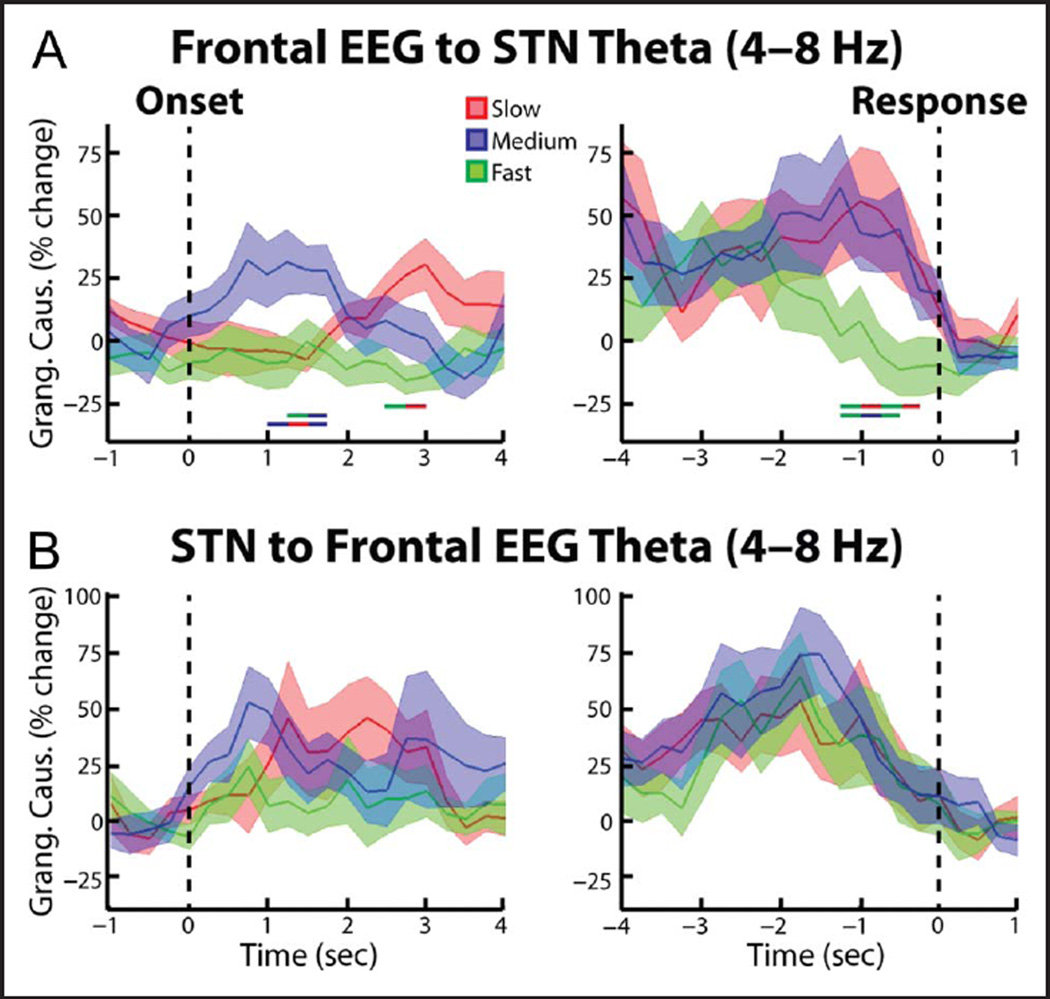
Figure 6.
Group average percent change in theta band (4—8 Hz) spectral Granger causality between frontal EEG and STN LFP. (A) EEG—STN spectral Granger causality (mean ± SEM) aligned to the congruent dot motion onset (left). Changes were found relative to a 1-sec long time period between trials during which all dots moved randomly in any direction. Thick lines denoting significant time points between two trial types are shown (color of line indicates which two trial types were compared, p = .021 for slow vs. fast comparison, p = .047 for medium vs. fast comparison, p = .020 for slow vs. medium comparison, permutation testing). (A, right) Same as (A, left) but for data aligned to the response (p = .014 for slow vs. fast comparison, p = .009 for medium vs. fast comparison, permutation testing. (B) Same as A, but for the STN—frontal EEG direction. No significant differences were observed.

