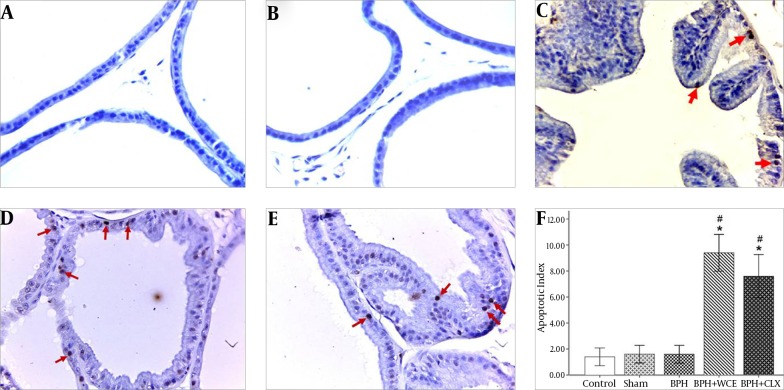
Figure 2. TUNEL Staining of the Prostate Tissues of Different Groups of Rats, Magnification × 400).
Namely the control, A; sham, B; BPH, C; BPH + WCE, D and BPH + CLX, E groups. The histogram, F shows the number of apoptotic cells. * P < 0.001 vs. control group; # P < 0.001 vs. BPH group. Red arrows indicate the apoptotic cells.

