
Table 4.
Mean and standard deviation of diameters of PCL-3 particles and their distributions produced under different working distances.
| Working distance dn (µm) Solution concentration | 10 cm | 12.5 cm | 15 cm | Particles diameter distributions |
|---|---|---|---|---|
| 1 wt.% | 18.9 ± 7.0 μm | 20.1 ± 6.4 μm | 20.6 ± 9.0 μm | 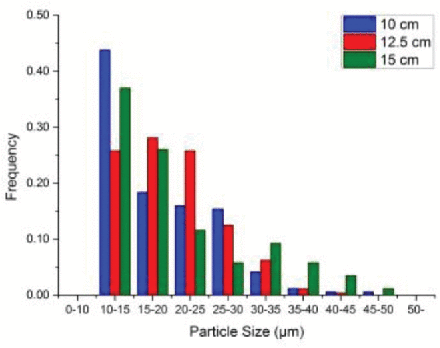 |
| 5 wt.% | 30.0 ± 12.7 μm | 34.2 ± 12.9 μm | 35.8 ± 8.0 μm | 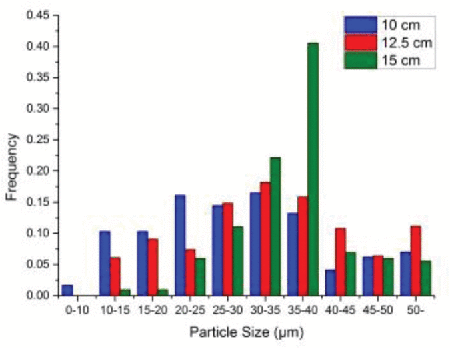 |
| 9 wt.% * | 33.6 ± 17.3 μm | 39.0 ± 18.0 μm | 54.3 ± 15.8 μm | 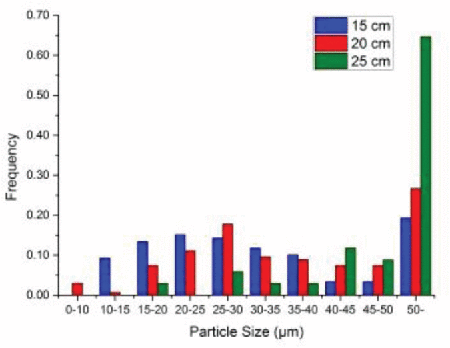 |
*
For the 9 wt.% PCL solution, the working distance was 15 cm, 20 cm, and 25 cm. The relationship between sphere sizes and working distance/solution concentration was also plotted using x-y-z spatial coordinates. These plots were included as supplementary material.