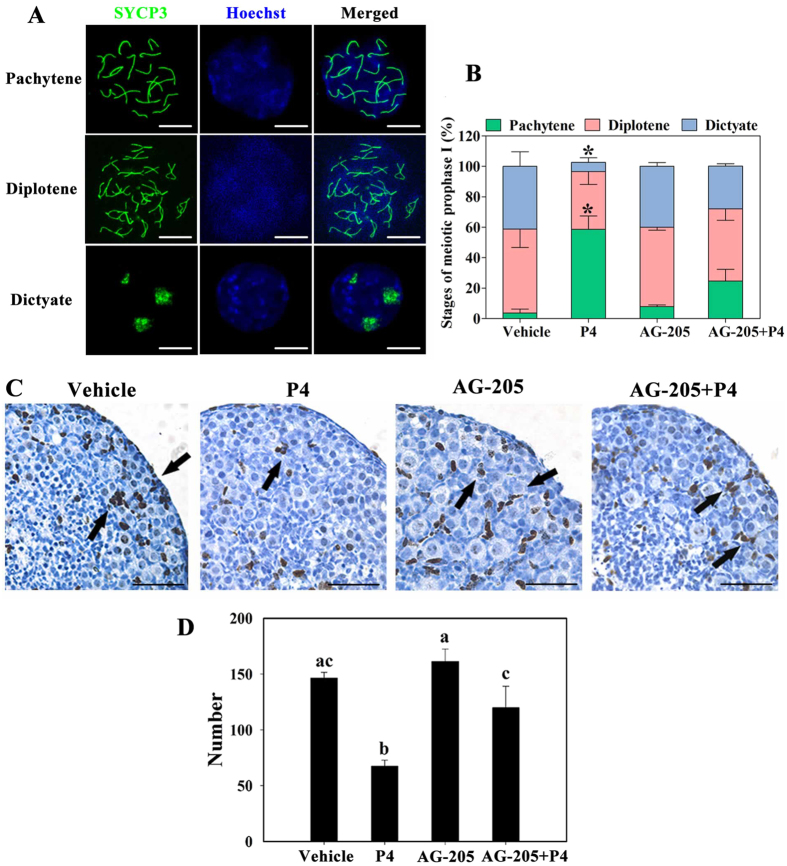
Figure 5. P4–PGRMC1 interaction suppressed meiotic progression and pre-granulosa cell proliferation.
For this, 16.5 dpc ovaries were isolated and cultured with vehicle, 1 μM P4 alone, 5 μM AG-205 alone, or both AG-205 and P4 for 4 days. The spread chromosomes of cultured ovaries were labeled with anti-SYCP3 antibody (green) and Hoechst 33342 (blue) to identify (A) and analyze (B) the proportion of oocytes in each stage of meiotic prophase I; scale bar = 10 μm. *Denotes statistical significance at P < 0.05 between vehicle and treated ovaries (ANOVA and post hoc test, 3 independent replicates, in each replicate every treatment contained 3 ovaries). Next, the paraffinized ovary sections were subjected to immunohistochemical analysis by staining with anti-Ki67 antibody to determine cell proliferation (C). Arrows indicate proliferating pre-granulosa cells; scale bar = 25 μm. The number of Ki67-positive pre-granulosa cells was counted in the largest cross-section of each ovary from each treatment group (D). Different letters denote statistical significance at P < 0.05 (ANOVA and post hoc test, n = 3, 3 independent replicates).

