
Table 2. Assignment of preclinical models to the closest subtype.
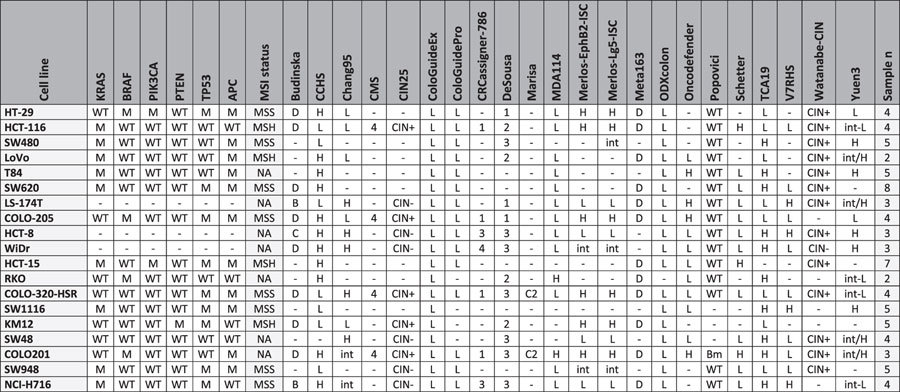
Assignment of the most frequently utilized cell lines to each of the molecular classifiers based on a gene-array-based expression profile of the cell line. In case multiple arrays were utilized for a given cell line, and more than 40% of the arrays delivered different results, then the given cell line was not classified for that classificator. Mutation status is shown for the six most important genes, and MSI status is also shown for each cell line. Abbreviations: M: mutant, WT: wild type, H: high, L: low, int: intermediate, Bm: BRAF mutant, MSH: MSI-High, MSS: MSI Stable, Sample n: number of gene chip samples providing expression data for the classification.