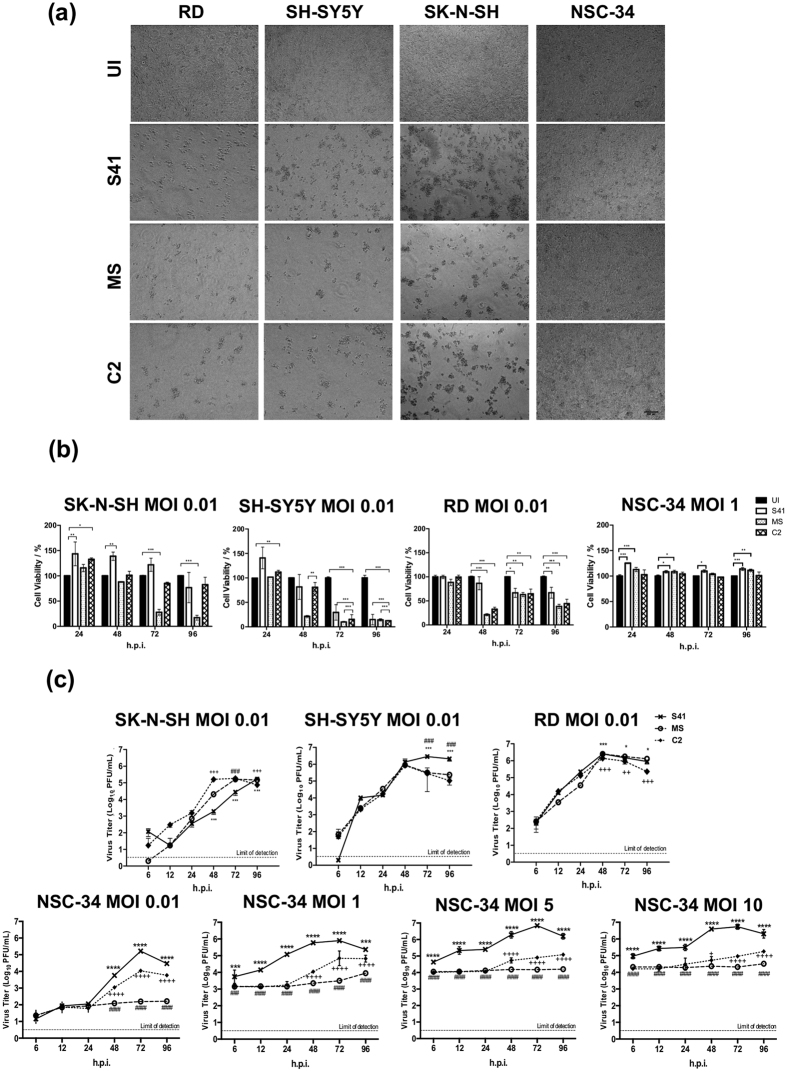
Figure 1. Morphological changes, viability and virus titers of EV71-infected cultures.
(a) Phase-contrast microscopic images of EV71-infected RD, SH-SY5Y, SK-N-SH and NSC-34 cells (MOI 1) at 96 h.p.i. The images were captured at 20× magnification. Representative views are shown. UI, uninfected control. (b) Cell viability of EV71-infected RD, SK-N-SH, SH-SY5Y and NSC-34 cells was determined using alamarBlue™ viability assay. Data are expressed as the mean ± SD of technical triplicates. Statistical analysis was performed using two-way ANOVA test with Bonferroni correction (*p < 0.1, **p < 0.01, ***p < 0.001). (c) SK-N-SH, SH-SY5Y, RD and NSC-34 cells were infected with S41, MS and C2 strains at the indicated MOIs. At the indicated time points post-infection, the virus titers in the culture supernatants were determined by plaque assay. The data are expressed as the mean ± SD of technical triplicates. Statistical analysis was performed using two-way ANOVA test with Bonferroni correction. Legends: *statistical analysis between S41- and C2-infected cells; #statistical analysis between S41- and MS-infected cells; +statistical analysis between MS- and C2-infected cells. *,# or +p < 0.1, **, ## or ++p < 0.01, ***, ### or +++p < 0.001. These experiments were performed twice independently. One representative set is shown. Scale bar denotes 100 μm.

