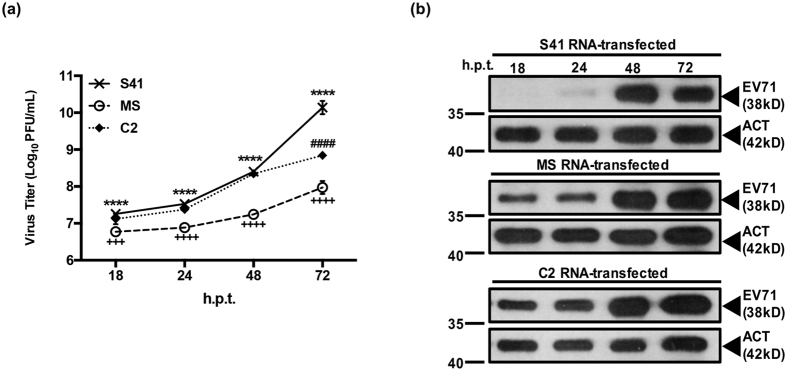
Figure 3. Virus production in NSC-34 cells transfected with purified virus genome.
NSC-34 cells were transfected with 0.25 μg of S41, MS and C2 viral genome RNA. (a) At the indicated time points post-transfection, virus titers in the culture supernatants were determined by plaque assay. Data are expressed as the mean ± SD of technical triplicates. Legends: *statistical analysis between S41- and C2-infected cells; #statistical analysis between S41- and MS-infected cells; +statistical analysis between MS- and C2-infected cells. *,# or +p < 0.1, **, ## or ++p < 0.01, ***, ### or +++p < 0.001 (b) Western blot analysis of cell lysates using anti-VP0/VP1 primary antibodies. The band intensities were normalized against β-actin and analysed using ImageJ software. Gels images were cropped. These experiments were performed twice independently. One representative set is shown.

