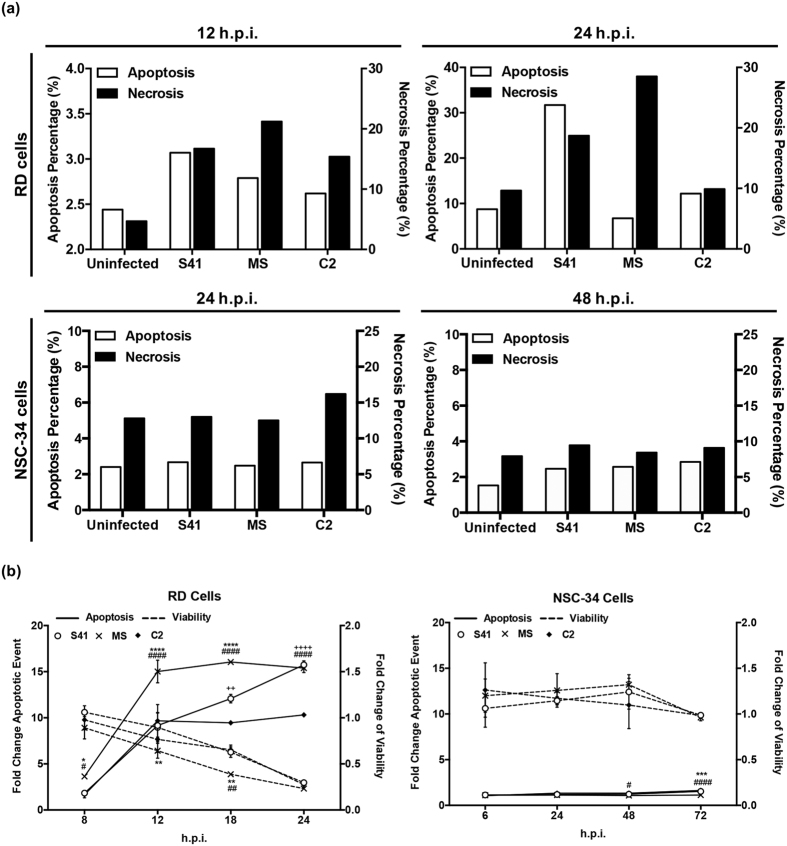
Figure 4. Apoptosis in EV71-infected RD and NSC-34 cells.
RD and NSC-34 cells were infected with S41, C2 and MS strains at MOI 1 and 10, respectively. (a) Annexin V/ Propidium Iodide staining. At the indicated time points post-infection, the cells were harvested and stained for Annexin V and Propidium Iodide, prior to FACS analysis (see plots in Fig. S3). Data are expressed as the percentage of necrotic or apoptotic cells. (b) Cell viability and caspase activation. At the indicated time points post-infection, the cells were harvested and processed in the ApoLive-Glo™ multiplex assay. Data are expressed as the mean ± SD of technical triplicates. Statistical analysis was performed using two-way ANOVA with Tukey’s post test. Legends: *statistical analysis between S41- and MS-infected cells; +statistical analysis between S41- and C2-infected cells; #statistical analysis between MS- and C2-infected cells. *,# or +p < 0.05, **, ## or ++p < 0.005, ***, ### or +++p < 0.0005, ****, #### or ++++p < 0.0001. These experiments were performed twice independently. One representative set is shown.

