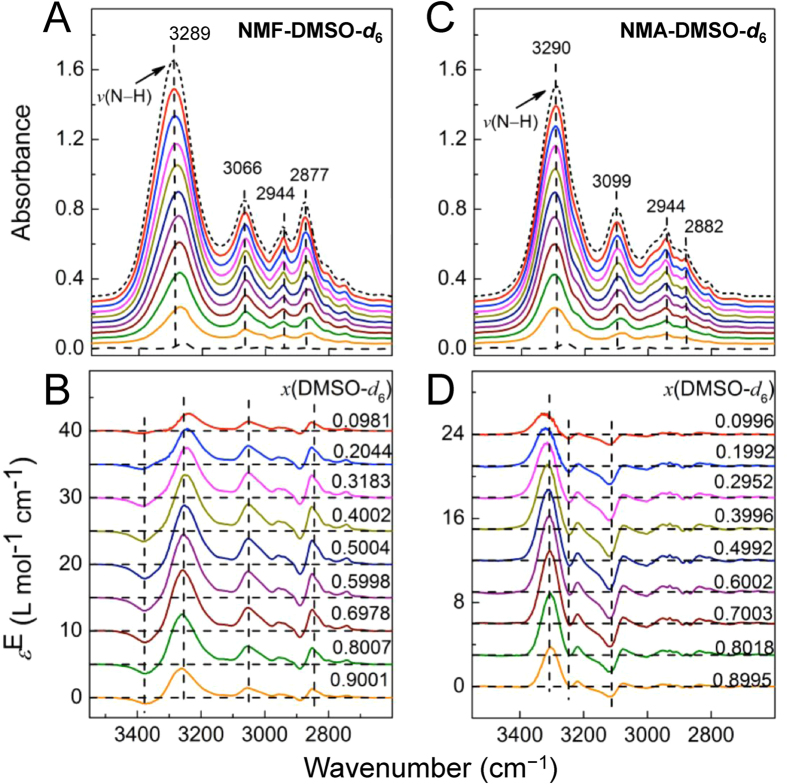
Figure 2.
The IR (A,C) and excess IR (B,D) spectra of NMF-DMSO-d6 (A,B) and NMA-DMSO-d6 (C,D) systems in the range of N−H and C−H stretching vibration region. The short-dashed line and dashed line in (A,C) depict the spectra of pure NMF/NMA and DMSO-d6. The vertical dashed lines are used to guide eyes. The horizontal dashed lines in (B,D) are relative baselines for respective excess IR spectra. From top to bottom in (A,C) the mole fraction of DMSO-d6 increases from 0 to 1. The precise mole fractions are labeled in (B,D).

