
Fig. 1.
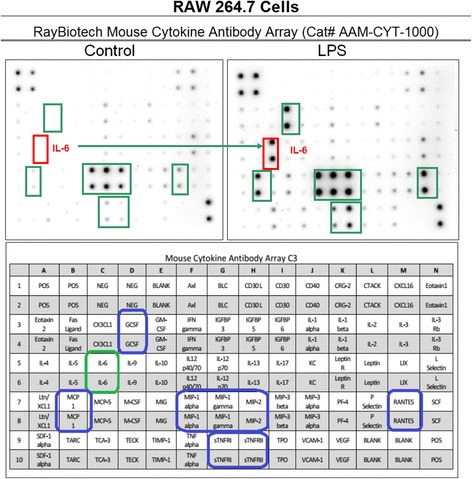
Cytokine release profile in LPS activated RAW 264.7 cells. The data are displayed as the cytokine array blot image and array grid layout with leading changes presented in highlighted boxes
Official websites use .gov
A
.gov website belongs to an official
government organization in the United States.
Secure .gov websites use HTTPS
A lock (
) or https:// means you've safely
connected to the .gov website. Share sensitive
information only on official, secure websites.
Cytokine release profile in LPS activated RAW 264.7 cells. The data are displayed as the cytokine array blot image and array grid layout with leading changes presented in highlighted boxes