
Fig. 2.
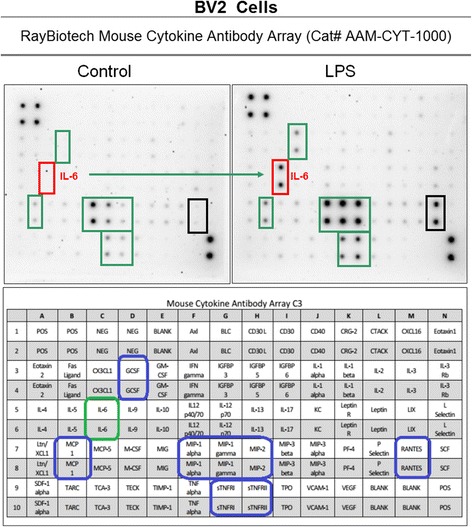
Cytokine release profile in LPS activated BV-2 cells. The data are displayed as the cytokine array blot image and array grid layout with leading changes presented in highlighted boxes
Official websites use .gov
A
.gov website belongs to an official
government organization in the United States.
Secure .gov websites use HTTPS
A lock (
) or https:// means you've safely
connected to the .gov website. Share sensitive
information only on official, secure websites.
Cytokine release profile in LPS activated BV-2 cells. The data are displayed as the cytokine array blot image and array grid layout with leading changes presented in highlighted boxes