
Fig. 3.
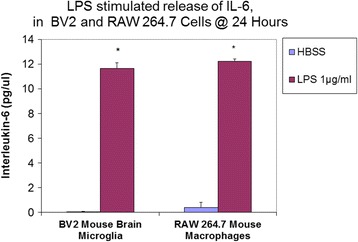
ELISA: Quantification of IL-6 in the supernatant of resting and LPS activated cells (BV-2 cells, RAW 264.7 cells). The data represent IL-6 (pg/μl) and are expressed as the Mean ± S. E. M., n = 3. Differences between resting and LPS activated cells were determined by a student’s T test (*) P < 0.001