
Fig. 4.
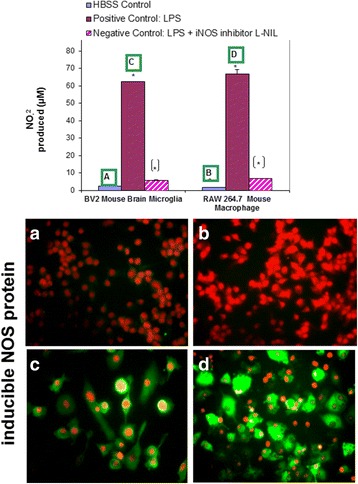
NO2- production in resting and LPS activated cells (BV-2 cells, RAW 264.7 cells) ± selective iNOS inhibitor: L-NIL (12 μg/mL). The data represent NO2- produced (μM) and are expressed as the Mean ± S. E. M., n = 3. Differences between resting and LPS activated cells were determined by a student’s T test (*) P < 0.001. Differences between LPS vs. LPS/L-NIL treated cells were determined by a student’s T test [*] P < 0.001. iNOS expression was analyzed by ICC using rabbit anti-mouse iNOS/goat anti-rabbit Alexafluor 488, in fixed permeabilized, propidium iodide nuclear counterstained cells (a) resting BV-2 cells (b) resting RAW 264.7 cells (c) LPS activated BV-2 cells (d) and RAW 264.7 cells