
Fig. 9.
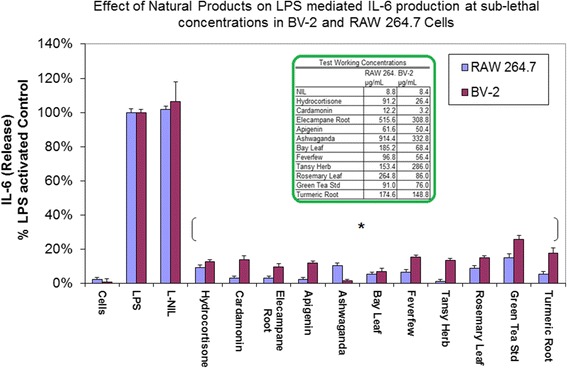
Effects of lead anti-inflammatory products on IL-6 release in LPS treated BV-2 and RAW 264.7 cells. The data represents IL-6 (as % LPS Control) and expressed as the Mean ± S.E.M., n = 3. Differences between activated cells ± natural compounds at sub-lethal dose were determined by a student’s T test (*) P < 0.001