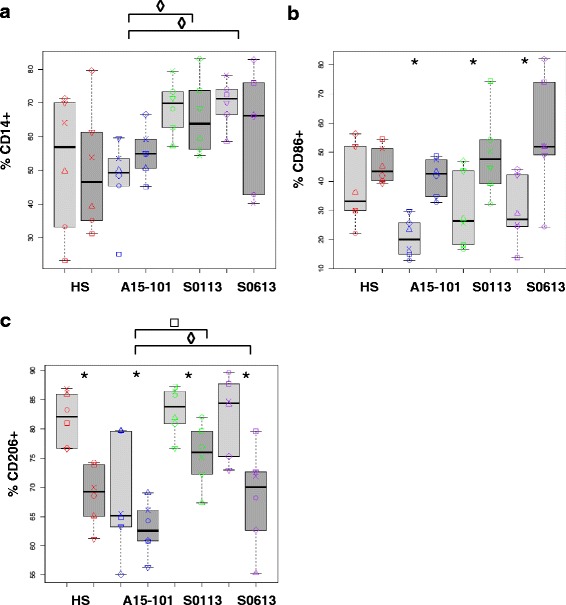
Fig. 3.

Surface marker expression of eqMoDC generated under the different serum conditions. EqMoDC were analysed by flow cytometry for cell surface expression of CD14 (a), CD86 (b) or CD206 (c). Results are displayed as percentage of positive cells for the respective marker. EqMoDC were generated under the respective serum conditions and were incubated overnight with the maturation cocktail (mature eqMoDC; dark grey boxplots) or maintained as immature eqMoDC (light grey boxplots). A non-parametric paired sample Wilcoxon (signed rank) test was used to identify significant differences between the HS condition and the different FBS conditions, respectively, within the maturation state (◊ indicates differences between immature eqMoDC; □ indicates differences between mature eqMoDC). The same test was also applied to investigate significant differences between immature and mature eqMoDC within each serum condition (indicated by asterisks). P-values ≤ 0.05 were considered statistically significant
